With Column reports, you select which columns to display, and which filters to set. The resultant report can be sorted by any of the fields displayed, with a single mouse click. Column reports can be saved as personal or public reports. You are able to select from any fields to which you have read permission. To prepare a new Column report, choose the Create New Column Report option. The screen presented to you will be similar to the following:
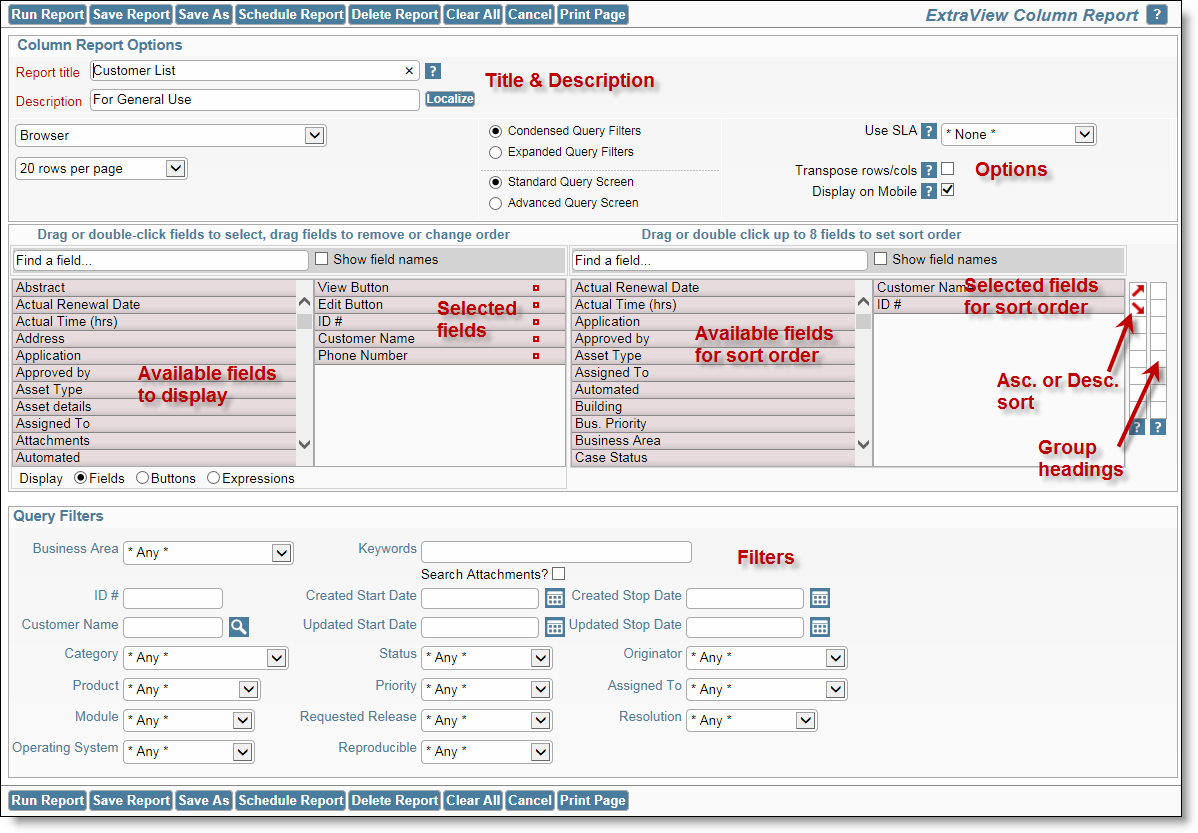
Creating a column report
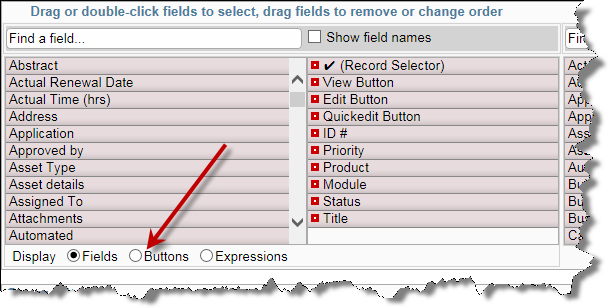
The possible buttons that can be placed on a column report are:
| Delete Button | This allows the deletion of the issue |
| Edit Button | This button allows you to edit the issue |
| History Button | Clicking this button displays the history of the issue |
| Quickedit Button | This allows you to use Quickedit mode within the report |
| View Button | Displays the Detailed Report for the issue |
| ✔ (Record Selector) | Places the record selector button on the menubar of the report. When you click this, a checkbox appears beside each issue which is used to select the issue for further processing, such as a mass update operation, to group the issues together, or to drag the issue within a workspace |
If you want to select from available calculated fields (expressions), click on the Expressions button:
Once a column has been selected to display on a report, a small button appears to the left of the field title. This allows you to set options or attributes, according to the type of field. To view or change the attributes, place your mouse cursor over the button, and click the right-hand mouse button. A window pops up, giving access to the available attributes.
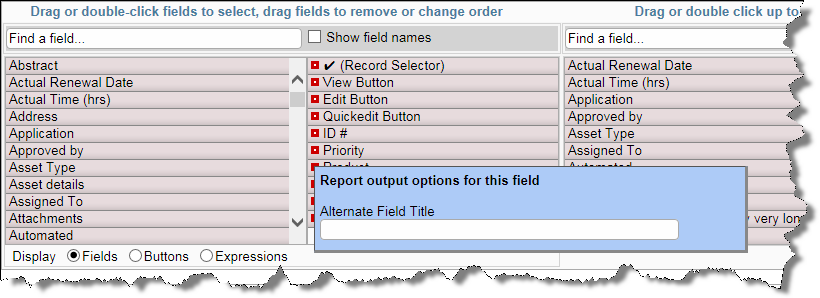
Selecting options for the Category column
In the example shown below, the user right-clicked on an expression type field, where they can enter an alternative title for the field to be displayed on this report’s output, an expression and an aggregate function. Calculated expressions are more fully explained in the Administration guide.
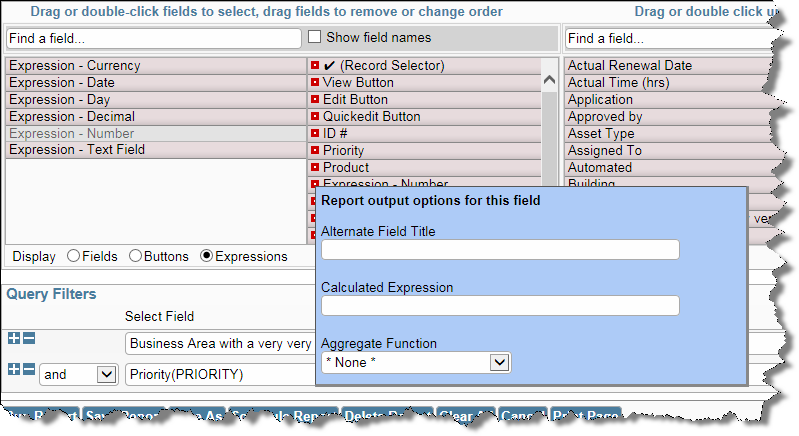
Selecting options on a field that allows calculated expressions
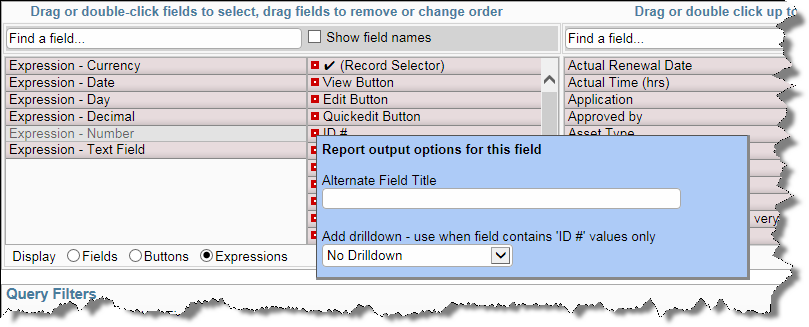
Drilldown option for text fields
Text fields, such as the issue ID field have one additional option, which allows a link to drilldown into the issue to be placed on the field when it is output to a report. This drilldown may be to the Detailed report, using the View function, or to the Edit screen, using the Edit function.
Note: You should only place a drilldown on a field that contains an issue number, such as Issue ID or a field with a related issue number. It is likely that using a drilldown will generate an error if there is not a valid ID.
| Field Display Type | Expression Results |
| Number, Currency, Decimal | The result will be numeric. For example, you may add or multiply different fields together: To calculate a field that shows the total of an amount plus 8% tax, use an expression similar to: $$AMOUNT$$ * 1.08 |
| Date, Day | The result will be another date. For example, if you want to calculate a due date, one week after a given date, you may use an expression similar to: $$DUE_DATE$$ + 7 |
| Text | This can be used to concatenate different text values together. For example, to produce a full name from a field named MYNAME plus a field named MYID, you may use an expression similar to: $$MYNAME$$ || ’ ‘ || $$MYID$$ Note the use of the || to concatenate text strings together. This is because the underlying database uses this convention as opposed to using the more natural + to concatenate two text strings. Also, note the use of single quotes around text literals. This is a standard SQL database convention. Double-quotes do not work, and you will receive an error if you use these. |
If there are numeric fields on the report that you have prepared, and the administrator has enabled totaling on the field, then the numeric fields displayed will be totaled.
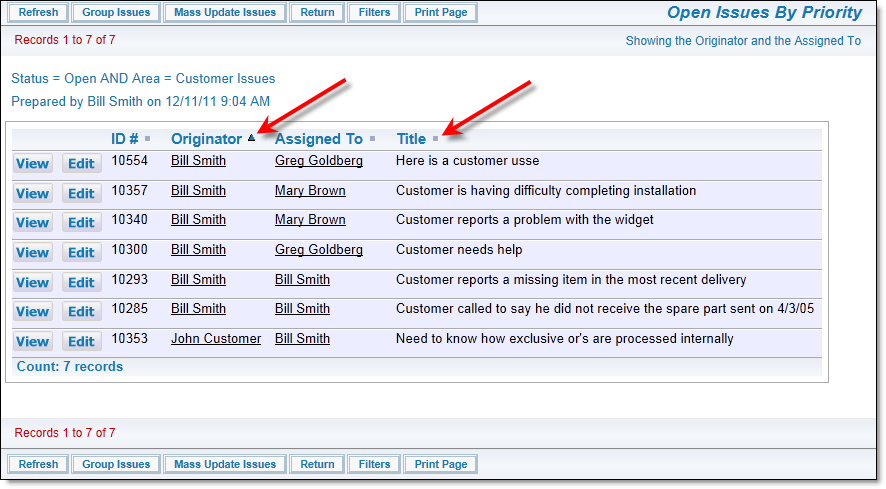
You can click on column titles to sort the report by the values in that column. Note that your administrator must have elected to allow sorting on each field, so not every column on a report may be sortable in this way. If it is sortable, a small grey icon appears to the right of the field. Click on the column title or icon to sort the output. One click sorts the column descending, and one more click sorts the column contents ascending.
If you click on the rightmost box by a field you have selected as a sort order, then the field is promoted to become a group heading on the output display. This is seen below, when the field Business Area and Assigned To fields were checked and were promoted to group headings. All four sort order fields that can be selected can be promoted to become group headings on a column report.
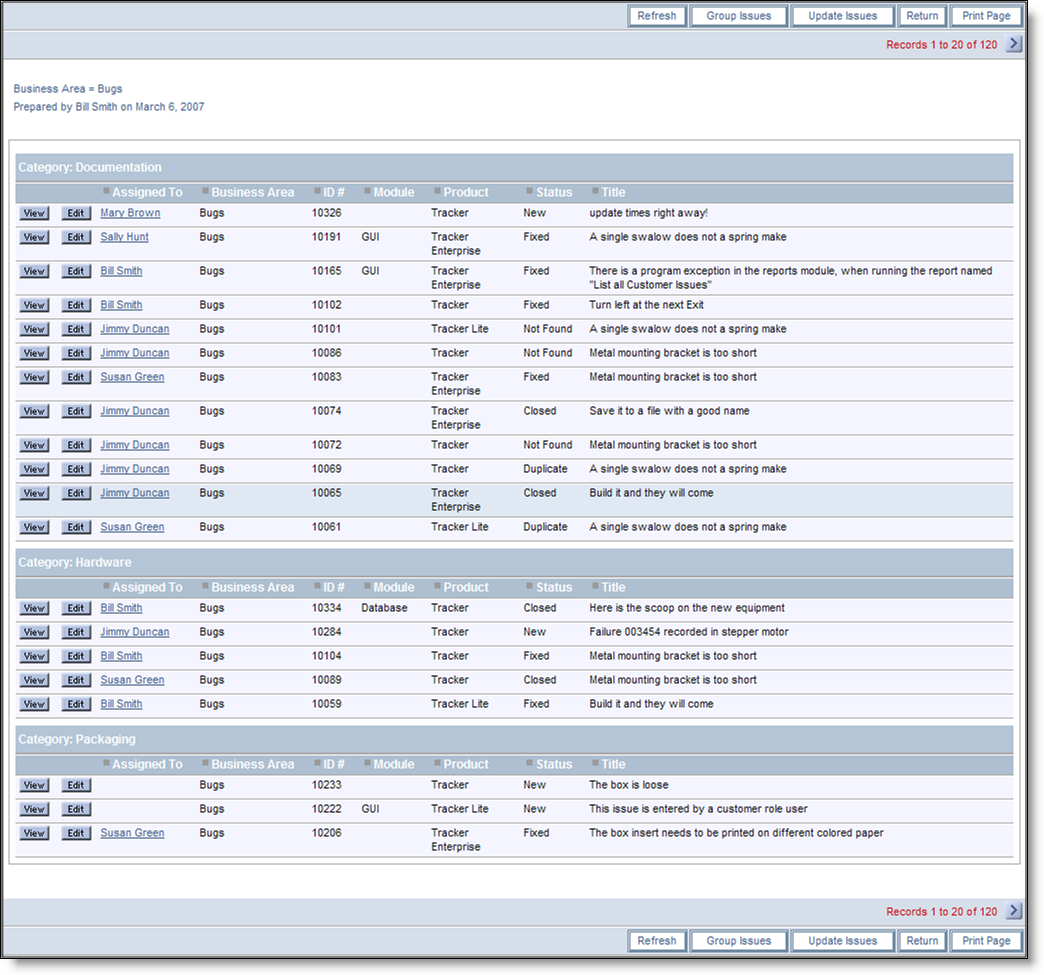
Sample column report with group headings
Column reports can work with hierarchies in two separate ways. These ways can also be combined together for output.
The first hierarchical report method uses a predefined hierarchy, as set up and named by your site administrator, and described on the page Reporting on Hierarchies. These hierarchies are typically of the parent-child variety, where one parent issue has some number of child records directly related to the parent issue. For example, a Customer issue may each have many Contacts. A report will display issues for this simple hierarchy in this fashion:
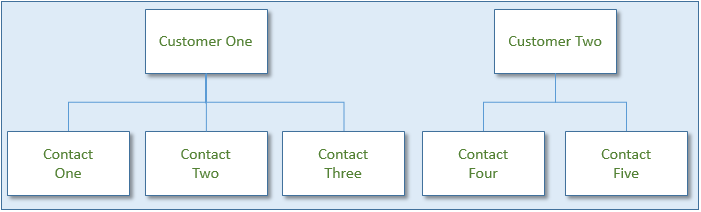
Logical Representation of Simple Parent-Child Hierarchy
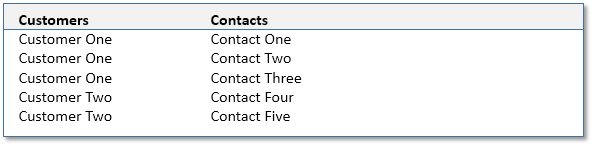
Report Output of Simple Parent-Child Hierarchy
The second method of hierarchical reports is to combine two or more hierarchies on a single report. This method relies on each hierarchy having the same parent field, but there are two (or more) separate child relationships. The different child records may not have anything in common with each other. These are termed side-by-side hierarchies on the report. Consider this set of relationships:
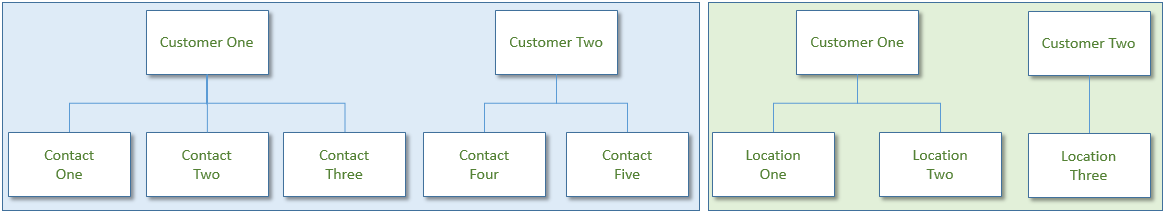
Logical Representation of Two Hierarchies with the Same Parent
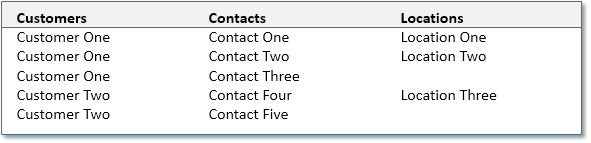
Report Output of Two Hierarchies with a Common Parent
Note that there is no direct relationship between the Contacts and the Locations, even though they are displayed on the same row of the report output.
It is possible to present multiple side-by-side hierarchies on a single report, and each of these hierarchies may have multiple levels. In all cases, the records from each of the side-by-side hierarchies will be rendered beginning with the top row of its parent value.
To create a report with a hierarchy, choose the hierarchy you wish to use from the list, as shown below. This will add a new section to the report editor, allowing you to add the fields to be displayed for each level of the hierarchy, as well as a filter section where you can set the conditions for displaying the records at that level:
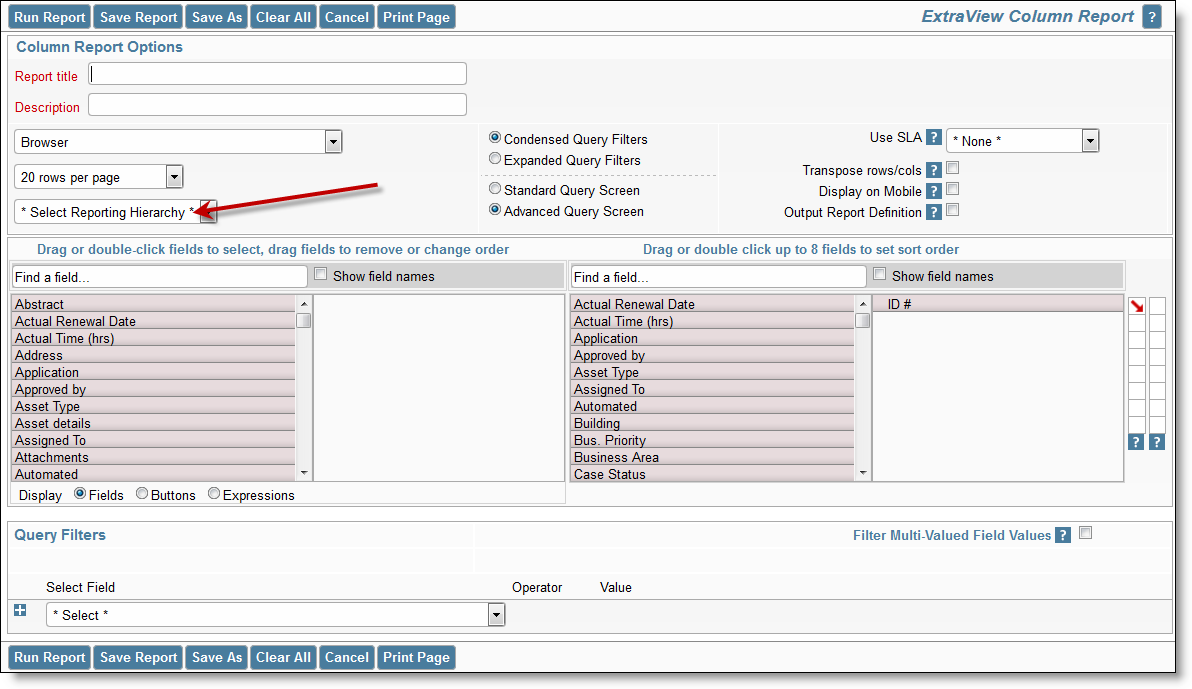
Selecting a Report Hierarchy
Once you have selected a report hierarchy, you select a side-by-side hierarchy with the additional select list that is displayed at the bottom of the first hierarchy:
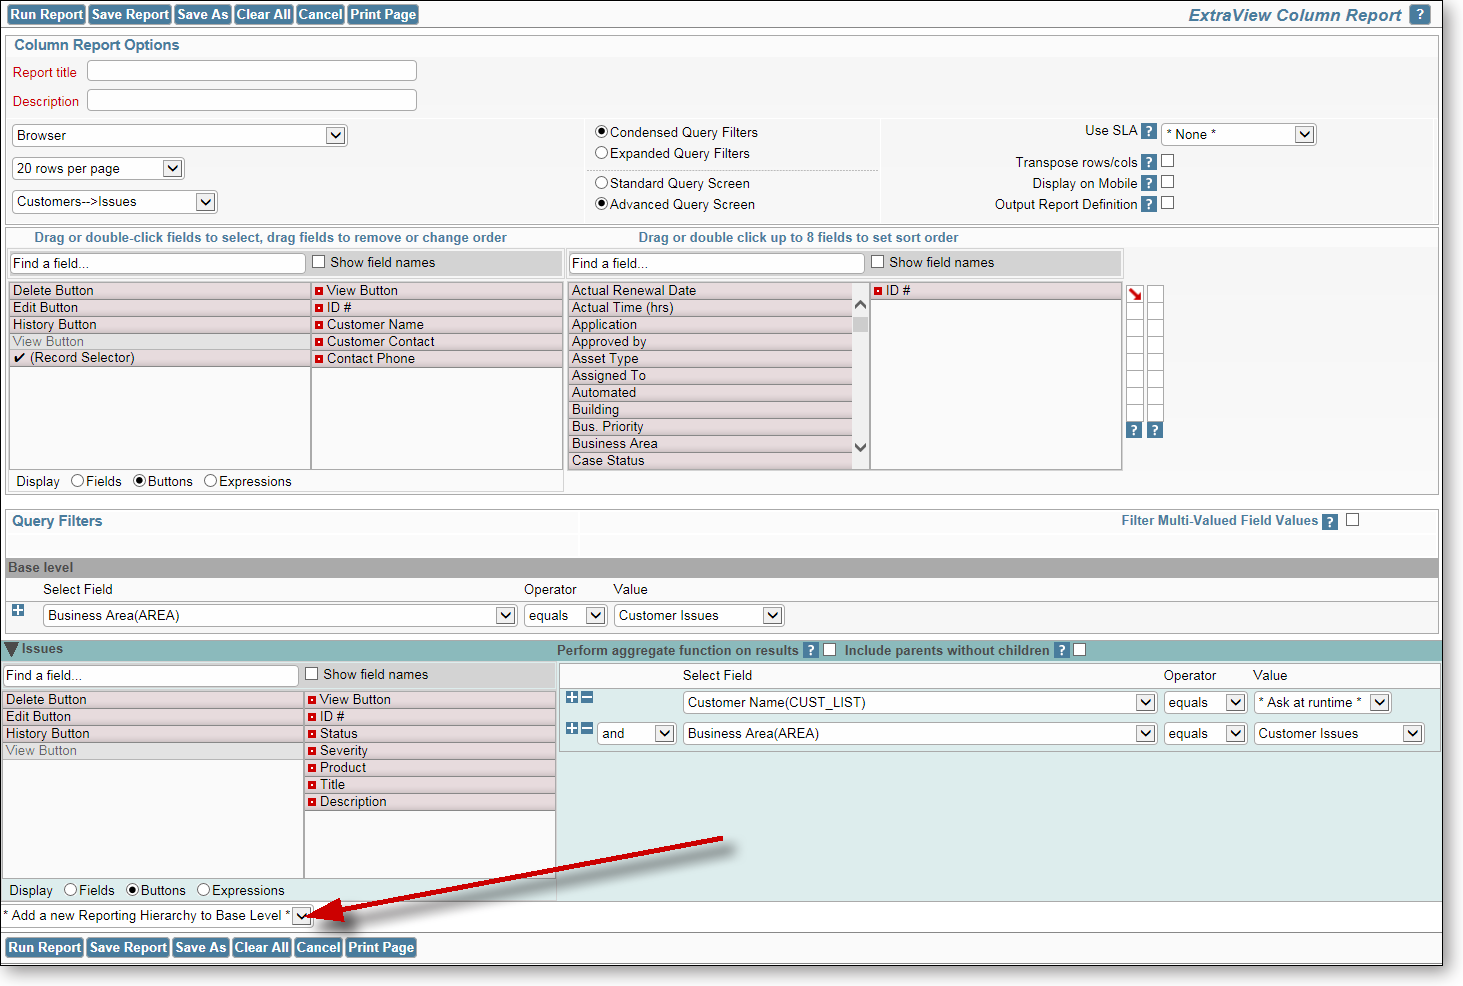
Adding a side-by-side hierarchy
After adding a side-by-side hierarchy, a new set of fields and filters, with a different background color appear. The side-by-side hierarchy that you select should have the same parent field as the first report hierarchy you selected, else you will not obtain meaningful results.
Within the report result output, there is the usual count of records in the form Displaying records 1 to nn records of yy. Note that the nn refers to the number of records on the page, and yy refers to the total number of issues presented in the report. Given that the report involves one-to-many relationships, this number is likely to be greater than the number of rows on the report.