Conditional Formatting of Results
Conditional formatting of the results on report output can accomplish many criteria. The formatting attributes may be applied to these report types:
- Column reports
- Summary reports
- Matrix reports
- Treegrid reports.
The formatting that may be applied is one of the following:
- Make values on the output have a different color
- Make the background color of a value on the output have a different color
- Make the text of the value bold
- Make the text of the value italic
- Place a colored dot within the cell that holds the value
- Conditionally hiding a value dependent on one or more conditions.
More than one formatting value may be applied to a single value on the report, but it should be recognized that conflicts may arise. For example, you might want to place the following two conditional attributes within a report:
- Make the background color of a cell colored blue, if the Category field equals Software
- Make the background color of the same cell red, if the Priority field equals High.
If both conditions are true, there is a conflict and only one of the conditional formatting attributes can be applied. No error will result, but only the first condition will be applied.
Creating Conditional Formatting for Column & Treegrid Reports
Within the report editors, right-click on the small red button on a field selected for the report. If the field supports conditional formats, this button will appear:
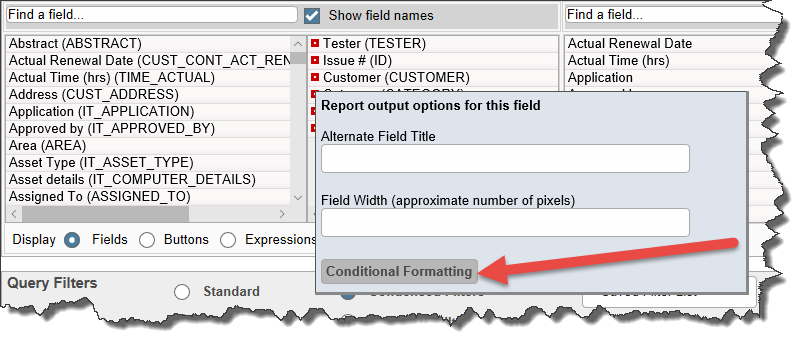
Clicking this button leads to a popup:
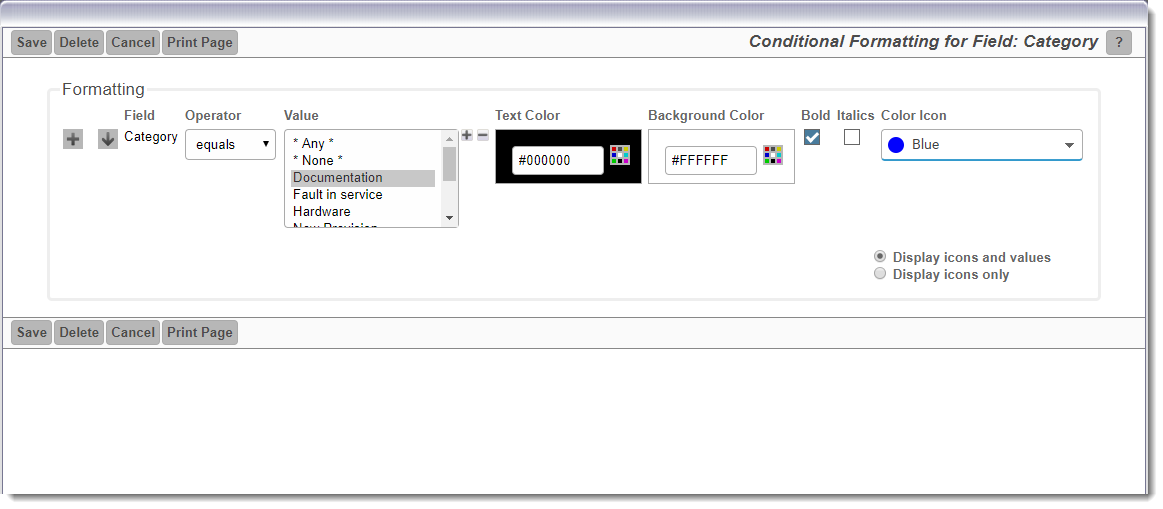
The user may apply the conditional formatting as follows:
- The color of the text may be altered from the default black (#000000) color
- The color of the background to the value may be altered from the default white (#FFFFFF) color
- The text may be made bold
- The text may be italicized
- A color dot or emoticon can be placed by the value, or instead of the value
- Using the * Hide Value If * option in the select list will cause the value to be hidden on the report output if it meets the condition.
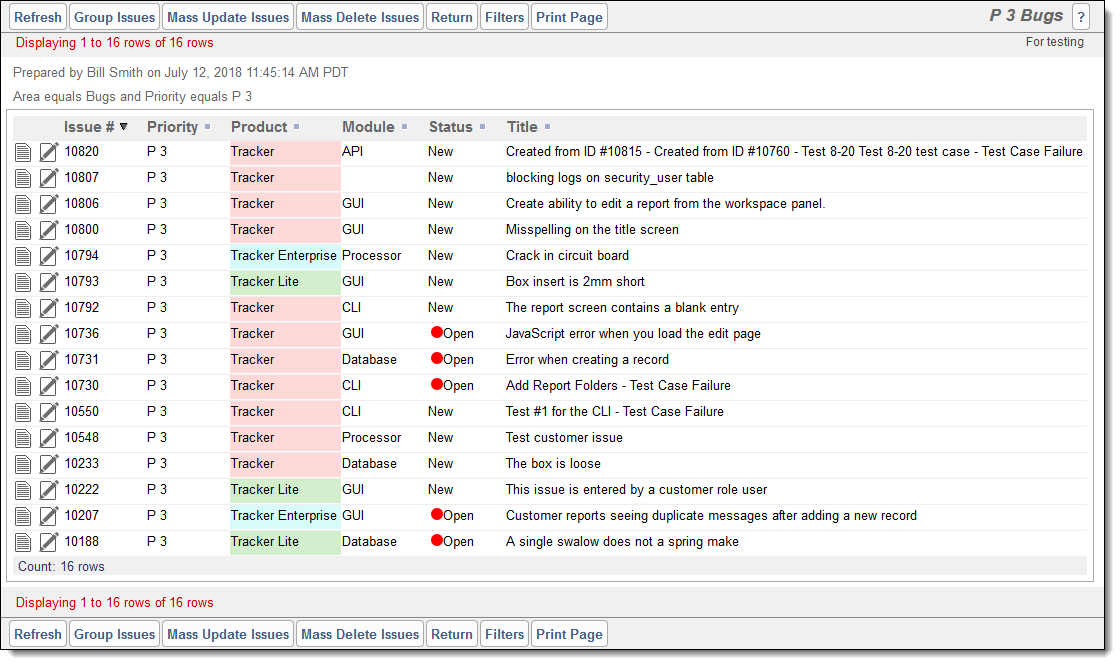
This shows conditional formatting being applied to a Column report:
- Each Product has a different background color applied to the value
- When the Status of a product is Open there is a red dot inserted.
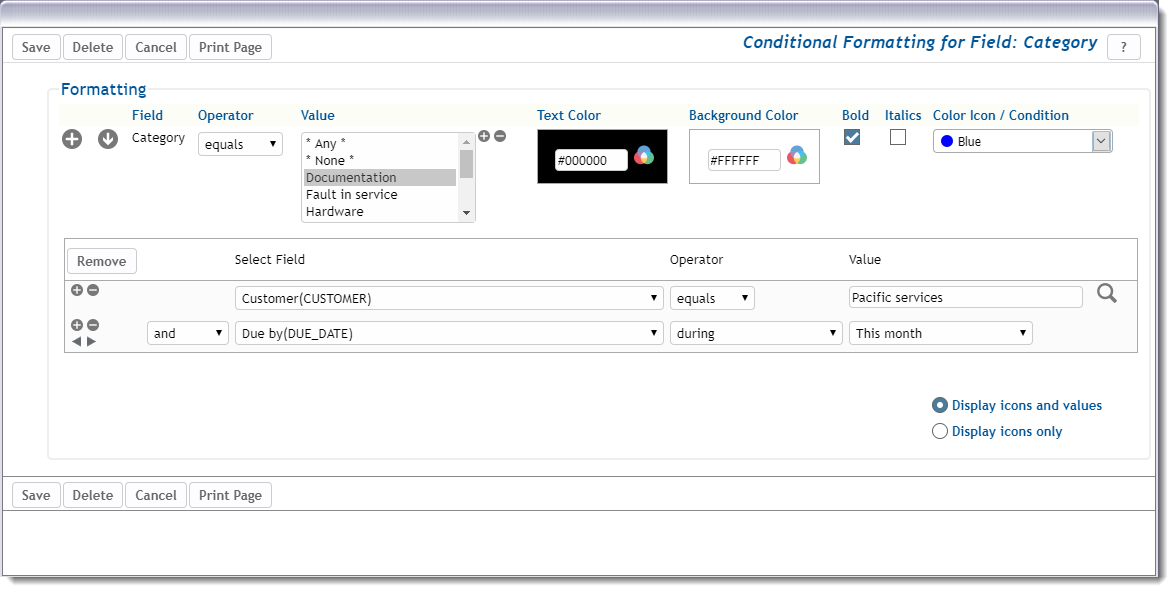
You may add multiple conditions for the selected field, using the  button. All conditions, except for the first, may be removed with the
  button. When you click the
  button, you may apply a style for the field value, based on more complex conditions that are based on any fields. These complex conditions may be set for any formatting condition and look like this:
Creating Conditional Formatting for Matrix & Summary Reports
The principals are similar to creating conditional formatting for Column and Treegrid reports, but with some distinct differences. First, you will typically create the formatting based upon the count of items on the report and secondly you may want to create conditional formats based on sub-totals, totals and the statistics computed in the results. As examples, you might want to format results based on these:
- Apply a format to any cell in the results when the count is greater or less than a number
- Apply a format to all of a row or column in the results when the count is greater or less than a number
- Apply a format to a total column, total row or both dependent upon the results.
To initiate conditional formatting of results within matrix and summary tables, consider the following screenshot:
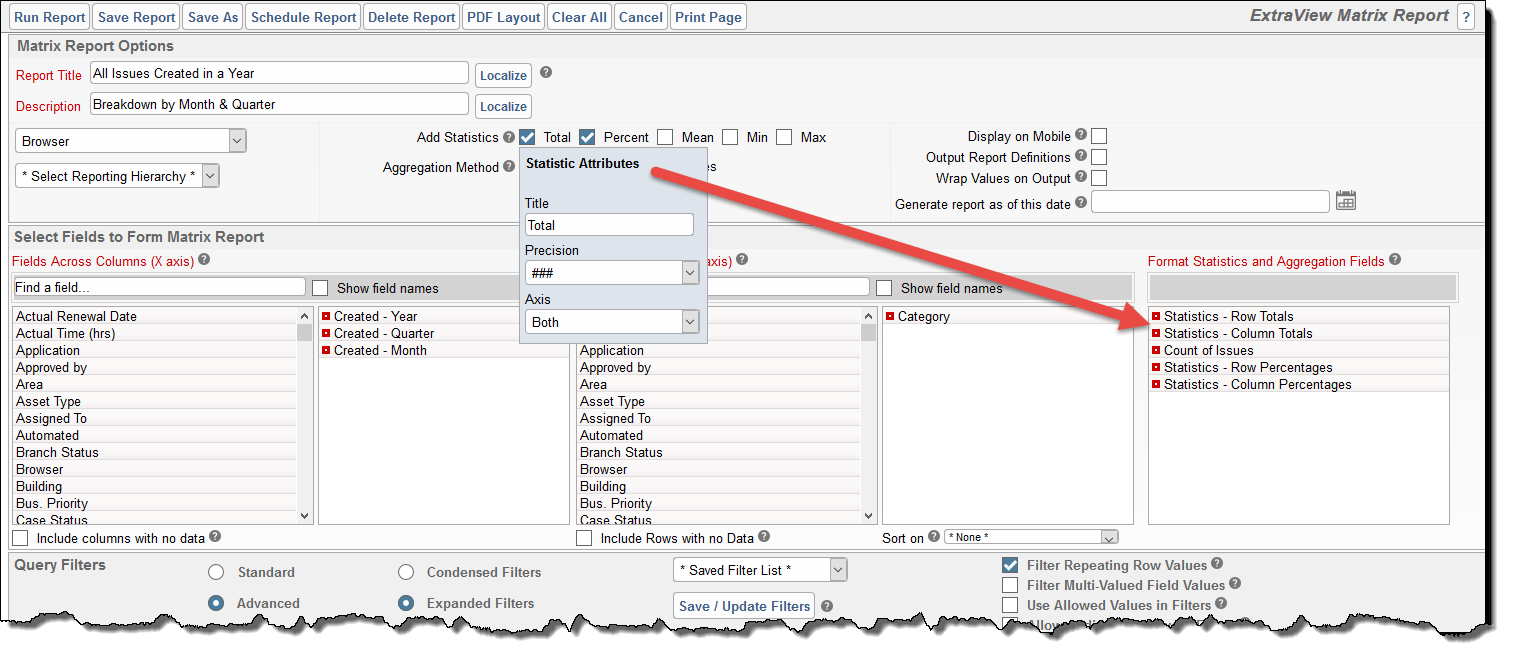
The user has chosen to add statistics in the form of Totals and Percentages. The screenshot further shows that having clicked on the Total label, the user has set a Title of Total, a Precision of ### and that the statistics should be applied to both axes. These choices led to the area of the screen titled Format Statistics and Aggregation Fields being populated with entries allowing the user to optionally apply conditional formats to the appropriate statistics of the report output. The user may then right-click on any of these statistics to apply conditional formats:

You may add multiple conditions for the selected field, using the  button. All conditions, except for the first, may be removed with the
  button. When you click the
  button, you may apply a style for the field value, based on more complex conditions that are based on any fields. These complex conditions may be set for any formatting condition. You may base the conditional format on the value of the result, selecting an operator, a value and the format.
The user may apply the conditional formatting as follows:
- The color of the text may be altered from the default black (#000000) color
- The color of the background to the value may be altered from the default white (#FFFFFF) color
- The text may be made bold
- The text may be italicized
- A color dot or emoticon can be placed by the value, or instead of the value.
Conditional Formatting on Time Periods and Historic Data
It is sometimes useful to be able to provide conditional formatting on data that has changed within a specific period. For example, you might want to provide the formatting on values that changed within the last week. This is accomplished with a complex filter as shown above and using the changed operator. As an example, this screenshot displays how to provide a green background on Assigned To values that changed in the last 7 days:
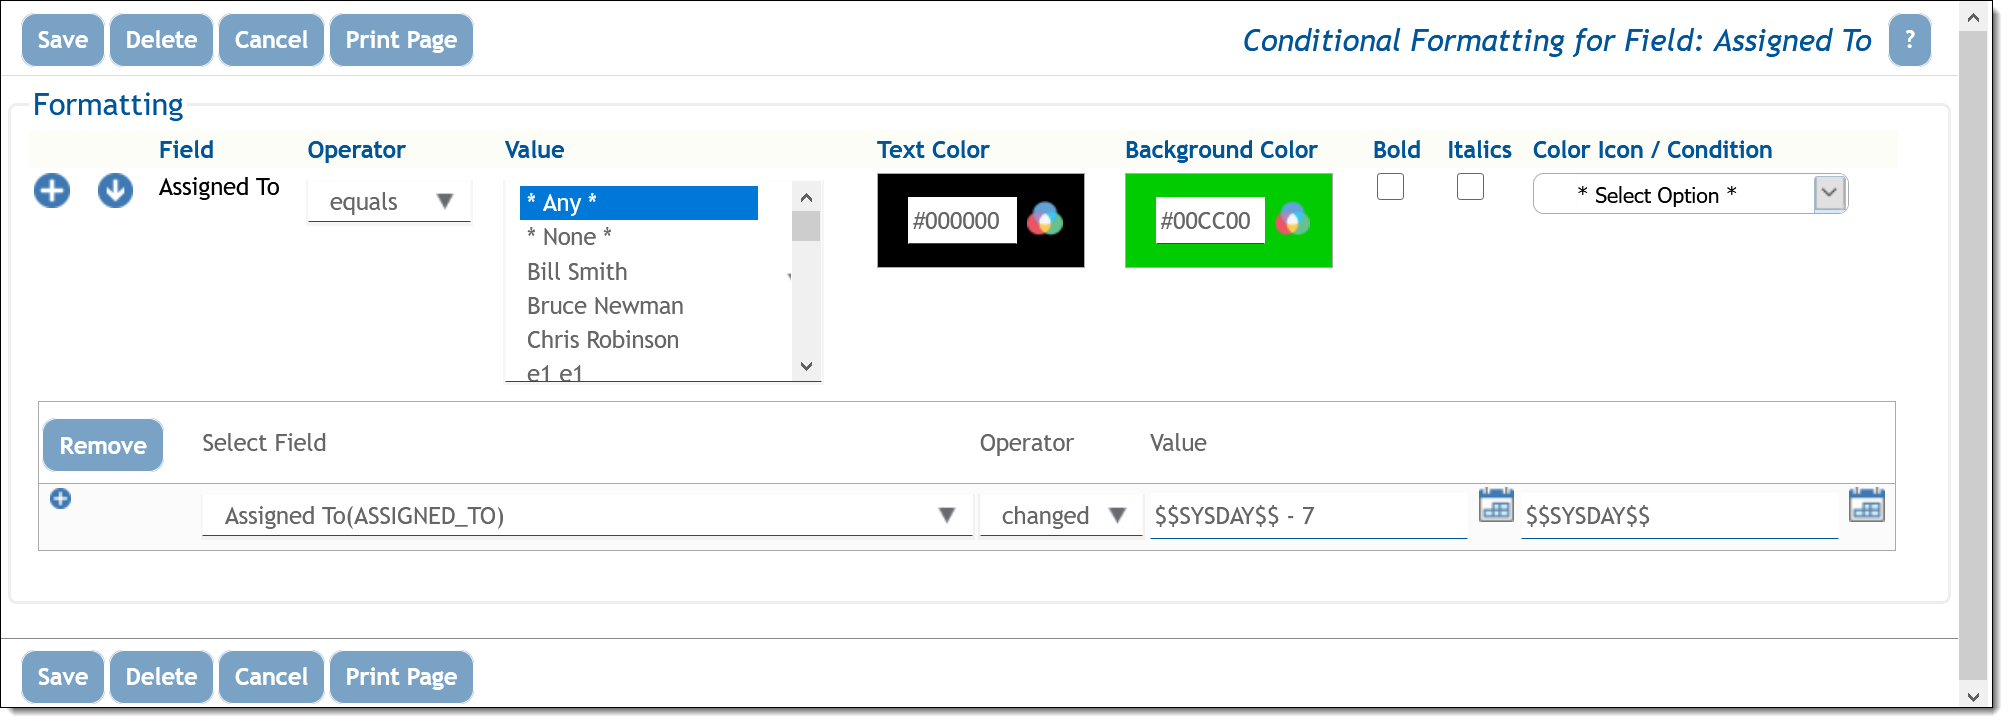
Resolving Conflicts
It is entirely possible that you might set up conflicting conditional formatting attributes. For example, you might set up a conditional formatting attribute that sets a background color when a specific condition is met. Another conditional formatting attribute on the same field might require a different background color to be set for a different filter condition. ExtraView will use the first specified conflicting attribute. In some cases, this can be an advantage, for example when you wish to set up ranges, according to counts within your report.
In this example, we want to establish background colors as follows:
| Range | Color |
| Less than, or equal to 7 | Green |
| Greater than, or equal to 7 but less than 11 | Purple |
| Greater than 11 | Red |
To take advantage of the fact that the attributes in the list are processed in order and the earliest one in the list is used when there is a conflict, you set the attributes as follows. The order is important:
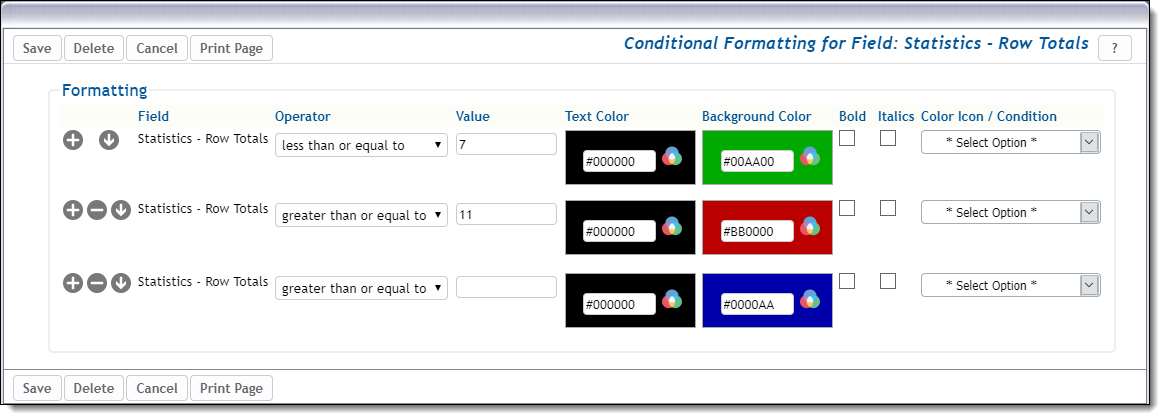
Limitations
- Output to Text – No conditional formatting is applied
- Output to Microsoft Excel (Plain output) – No conditional formatting is applied
- Output to PDF and Container Reports – Conditional formatting is not supported. It is expected that this limitation will be removed in a future release
- Output to Microsoft Excel (Formatted output) – Not all colored dots can be rendered. A marker is used within the output for those that cannot be displayed.
