Click here for administrative documentation
Geospatial reports allow the user to produce maps with the results of their queries. There are 3 types of map that can be produced, with somewhat different features:
-
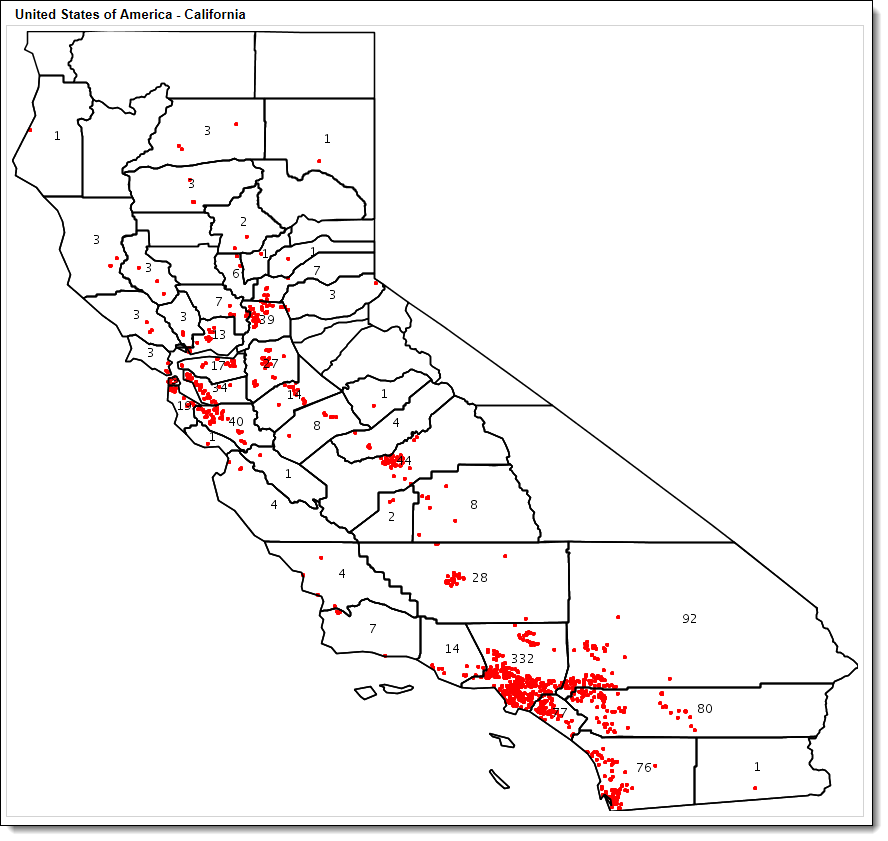
Interactive maps. These maps allow the user to perform a query and display a map that indicates a count of issues that occur at each location. These maps are interactive, i.e. the user can scroll around the map and zoom in and out. You can drilldown from the issues at a location to produce an ExtraView Quicklist of the issues that occur at that point. As you zoom in, the results become more granular with a circled number representing the number of issues within the vicinity. When all the issues being displayed are at a specific location, the circled number becomes a pointer. When you place your mouse over the pointer you will see details of the location and the number of issues that exist at that point.
Interactive maps may only be displayed within browsers and mobile clients. Maps are available for all parts of the world. Interactive geospatial reports may not be scheduled.
To scroll around the map, click on the background and move your mouse in the desired direction. To zoom in and out, use the thumbwheel on your mouse.

Outside of the common reporting features, the report editor that produces interactive maps allows the user to set the size of the map and the color to be used as the pointer to single issues at a map location.
Note that when you produce an interactive map, there is a button named Driving Directions on the menubar. Use this to highlight 2 points on the map and obtain driving directions between the points.
-
Shaded maps. These maps also allow the user to perform a query and display a map that indicates a count of issues that occur at each location. However, the report output is static with no user interaction. The user may set ranges for the number of results within an administrative boundary on the map, and a color corresponding to the number within the range is used to display the result. The reports may be output to the browser and to Adobe PDF format. These maps may be scheduled. Maps are available for the world down to each Country. Only maps for Northern America are available at more detailed levels, in the case of the USA they are available down to the County level and in the case of Canada to the Provincial level. All issues found at levels beneath the County, such as at the Zip code level are consolidated into the number of issues within the County for display.

Administrative boundaries indicate the level at which the map is displayed. These administrative boundaries are set up by the site administrator. Typically, four administrative levels are provided:
-
Boundary Level 1 - The world
-
Boundary Level 2 - The Country
-
Boundary Level 3 - The State / Province or similar within a country
-
Boundary Level 4 - The City or Zip code or Post code within the State / Province.
When creating a map within the report editor, the user chooses the levels to which the map is to be produced. For example, if only Boundary Level 1 is chosen, the map will be a map of the world. If Boundary levels 1 and 2 are selected the map will contain information at the Country level. If Levels 1,2 and 3 are chosen then the map will contain information down to the State / Province level. If Level 4 is added (which is typically either the City or Zip code level), then the maps will display the States and the Cities (or Zip codes) that are defined with the report filters.
The user may set the ranges for the colors according to how many issues they expect within each range. The color of the shading may be selected.
In addition the user may select to display a table of results, the count of issues within each administrative boundary and labels may be turned on and off. A legend displaying the ranges of the counts may be turned on and off.
-
Heat maps. These maps also allow the user to perform a query and display a map that indicates a count of issues that occur at each location. However, the report output is static with no user interaction. The user may set a color for the results displayed on the map, and a point with the color is drawn at the location. The reports may be output to the browser and to Adobe PDF format. These maps may be scheduled.
Heat maps are produced in a very similar manner to shaded maps, but as a single point represents each issue, only a single color may be selected. The only exception is that there is no legend, as there is no need with one point representing one issue.
Creating Geospatial Reports
-
From the Report screen, click New geospatial report
-
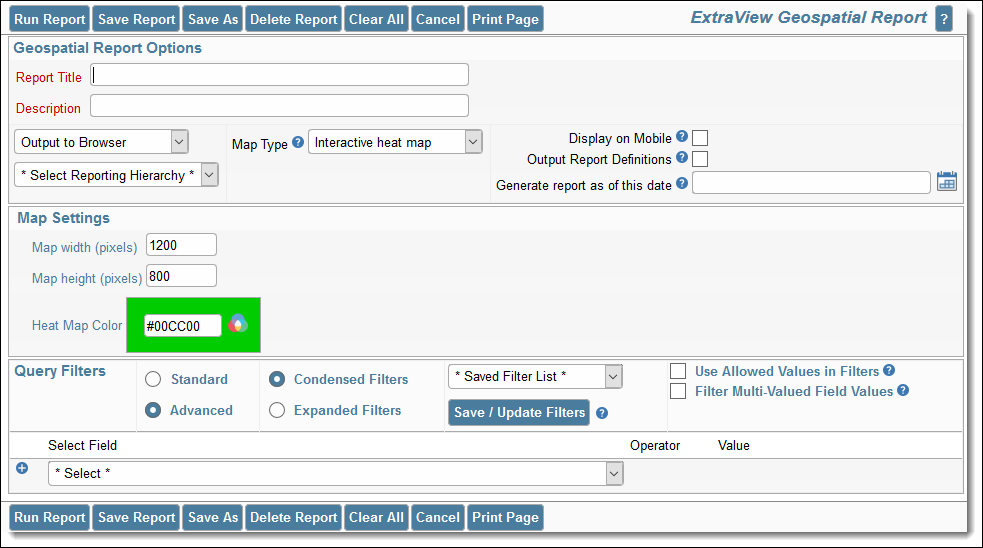
The report editor will look similar to this if the Interactive heat map option is selected:
-
If you have selected a shaded map or heat map, the Map Settings have additional prompts. These ask you to set the administrative level for the output. The administrative levels are set by your administrator, but they are typically:
-
Level 1 - The World
-
Level 2 - The Country
-
Level 3 - The State or Province
-
Level 4 - The City or the Zip / Postal Code
-
Level 1 is always set at the World. If only this is selected, then you will see a map of the world
-
Level 2 is the Country level and this implies that you will see a map of the World, with Country boundaries. Level 2 is usually selected as there is little point in seeing a map where only the issues in the entire world are selected and counted
-
Level 3 is typically set to the State / Province. If you have selected a filter for your issues with the USA or Canada as the value for the Country, this implies that you will see a map of the USA or Canada, broken into States or Provinces
-
Level 4 is typically either City or Zip/Postal code administrative level. An example is that if you have selected:
-
Level 1 = The World
-
Level 2 = Country
-
Level 3 = City
-
Filter 1: Country = USA
You will generate a map of each of the States within the USA. With a shaded map, each State will display the County boundaries (the lowest level of map available) and with each County containing shading that represents how many issues are counted within each County
-
If you use the settings in the previous bullet point to generate a heat map, the same maps will be generated, but with a colored dot within each County showing the location of each issue found at that location
-
Error handling - It is possible that your issues may contain incorrect or missing values for the latitude and longitude. In these cases the values may not be mapped, or be mapped in the wrong place. If the coordinate values for latitude and longitude are missing or cannot be placed on a map, ExtraView will display a count of these incorrect values at the bottom of the map. If the coordinates do not match a filter that you have set, but are valid for the administrative level you have selected, then more than one map may be generated. For example with these settings:
-
Level 1 = The World
-
Level 2 = Country
-
Level 3 = City
-
Filter 1: Country = USA
-
Filter 2: State = California
if data values for latitude and longitude exist within the filters, but do not exist within California, maps for these states will also be generated
-
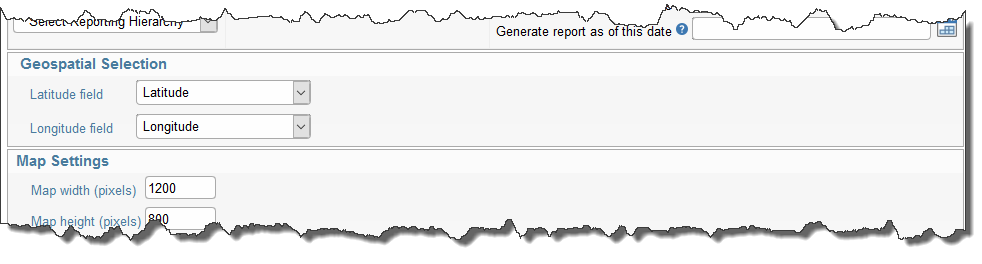
If more than one set of fields in your installation has been configured to store the values for latitude and longitude, then you need to identify which fields you are going to use for the report you are generating. The report editor will display an extra section to allow you to pick which latitude and longitude fields to use for the report:
Click here for administrative documentation