Admin Reports
Typically, only users with the Administration role are given access to these reports. For the current release there is only a single admin report, but in the future this list will be expanded. The key reason why these reports appear outside of the administration screens is in order to be able to use the Report Scheduler to provide an automated means to deliver the reports. Like all other reports, you should create the report, save it, then edit it to create a schedule.
User Sign On Log
The User Sign On log can also be accessed from the Administration utility of the same name. It is provided as a true report, in order that users may use the report scheduler to run and automatically distribute the report. When the user clicks on the report entry to create a New Admin Report, the following report editor screen appears:
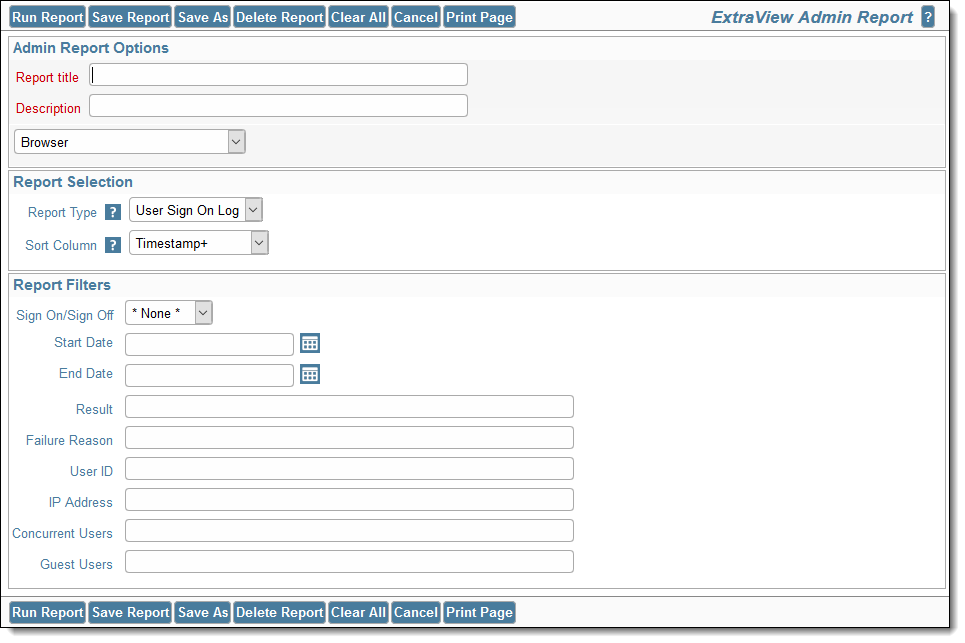
Usage is straightforward.
- The report type is User Sign On Log. You may select the sort order of the output with the Sort Column option
- The report may be output to the browser, text, Microsoft Word or Adobe PDF
- You may schedule the report through the Schedule Report button, once the report has been saved.
If you do not select any filters, the entire user sign on log will be produced. You may select a subset of the log using the filters provided.
- You can use $$SYSDATE$$ and $$SYSDAY$$ tokens in the Start Date and End Date fields. You can also specify simple arithmetic. For example, set the Start Date to $$SYSDAY$$-30 and the End Date to $$SYSDAY$$ to obtain the log for the last 30 days
- Both the Concurrent Users and Guest Users columns have the ability to filter using greater than and less than math. For example, enter >10 in the Concurrent Users column to see a log of all the times when more than 10 concurrent users were signed on
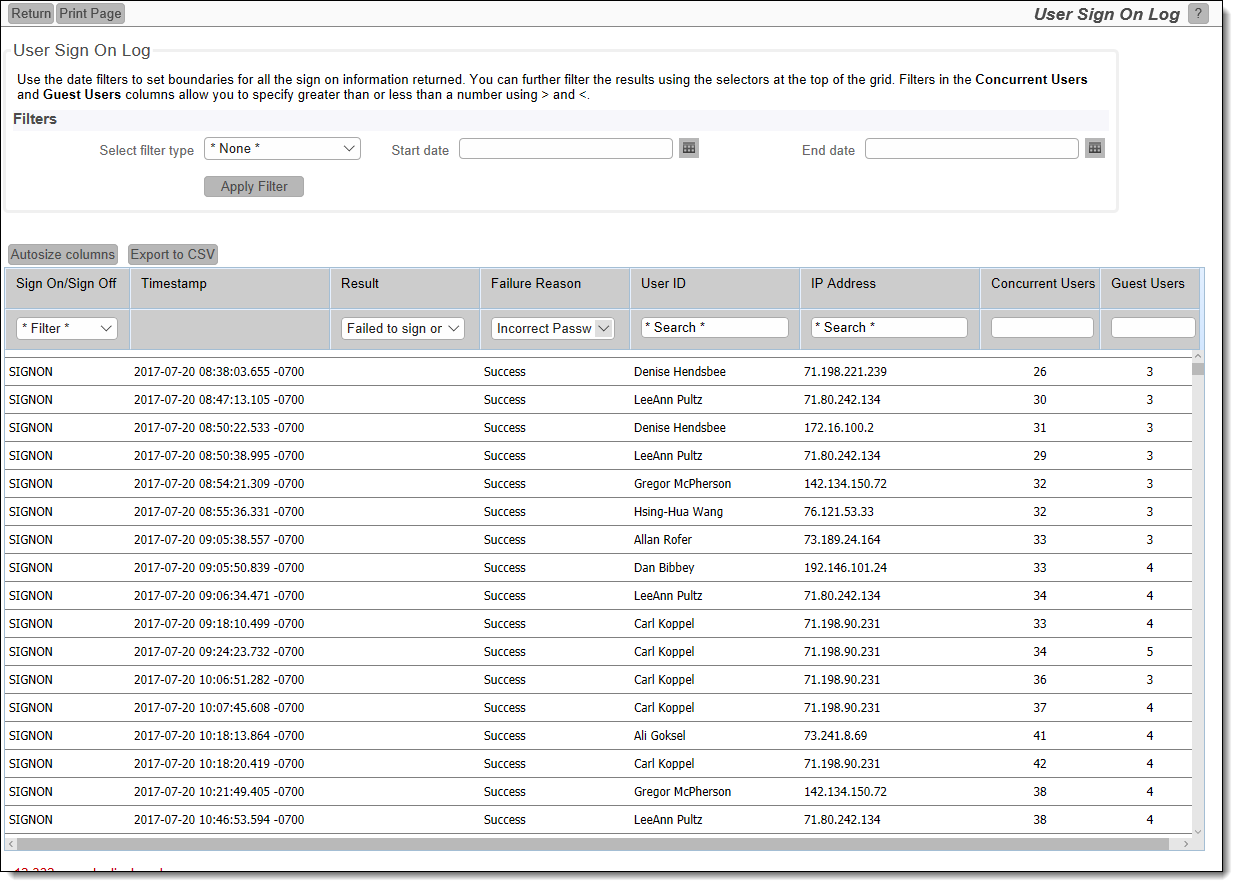
The output from the log will be similar to the following: