The ExtraView reporting feature offers the user a variety of different ways to report on, analyze and summarize the data within the database. After clicking the Report button on the navigation bar, users have the option of creating and running one of several report types; Column Report, Summary Report, Matrix Report, Dashboard Report, Charts and more. Reports can be created and saved for future use. If the administrator has granted you permission, the reports you create and save can be made available to all users; else the reports can be saved for your own personal use.
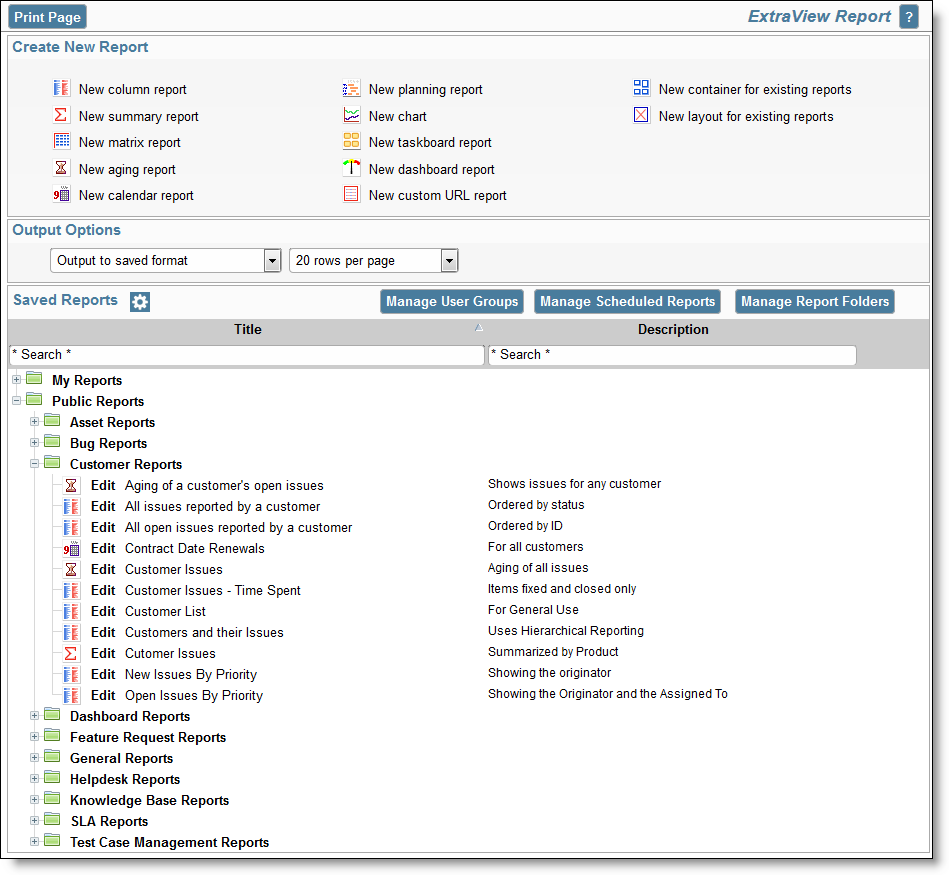
Sample Report screen
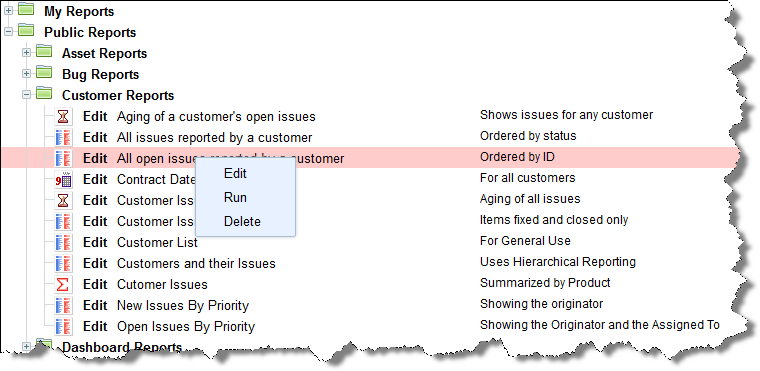
Reports can be manipulated on the report screen in a variety of ways:
-
Drag-and-Drop - You may drag a report from one folder to another report folder, assuming you have permission to write to the destination folder. You may also drag a complete folder to another location
-
Double-Click on the Report Icon - When you double-click on the report icon, you can alter the name or title of a report, without the need to enter the report editor
-
Right-click on Report Name or Title - When you right-click on a report, you see a popup menu that allows you to Edit, Run or Delete the report
Creating New Reports
To create a new report, you have the following report options:
-
New Column Report - Select the columns you want to display and which filters to set. For more information regarding Column Reports, please see here
-
New Summary Report - This allows you to design a report which will summarize on up to 10 fields, providing a total at each level. There is an option to provide additional statistics for each report level For more information regarding Summary Reports, please see here
-
New Matrix Report - You can select two fields as axes for the report, and see a count of all the issues at each coordinate For more information regarding Matrix Reports, please see here
-
New Aging Report - This provides a report that shows the time issues have spent within different statuses For more information regarding Aging Reports, please see here
-
New Calendar Report - These allow you to represent issues upon a calendar, with a date within each issue being used For more information regarding Calendar Reports, please see here
-
New Planning Report - Planning reports work with parent and child related issues. The child issues use a start and an end date on a calendar, and can be dragged to alter the dates. Visually, you are looking at many child issues on the report, and can therefore move the start and end dates of any issues to plan many interacting tasks For more information regarding Planning Reports, please see here
-
New Chart - Charts provide the ability to create pie, line, bar, and area charts For more information regarding Charts, please see here
-
New Taskboard Report - Ths report type allows issues to be represented as tiles on a background. The tiles represent tasks and can be dragged to new positions on the background. In this way, you can easily manipulate any number of issues to better organize work schedules and manage tasks For more information regarding Taskboard Reports, please see here
-
New Dashboard Report - Dashboard reports allow you to organize many reports into a single report. Typically dashboards will be shared to show key metrics that drive your organization For more information regarding Dashboard Reports, please see here
-
New Custom URL Report - These give access to run custom reports, and to place the contents of a URL external to ExtraView within your workspace or ExtraView screen For more information regarding Custom URL Reports, please see here
-
New Container Report - Container reports allow you place a number of reports together within a single PDF document that can be shared For more information regarding Container Reports, please see here
-
New Layout - Layouts can be used to summarize information and place the results within Container reports For more information regarding Layouts, please see here