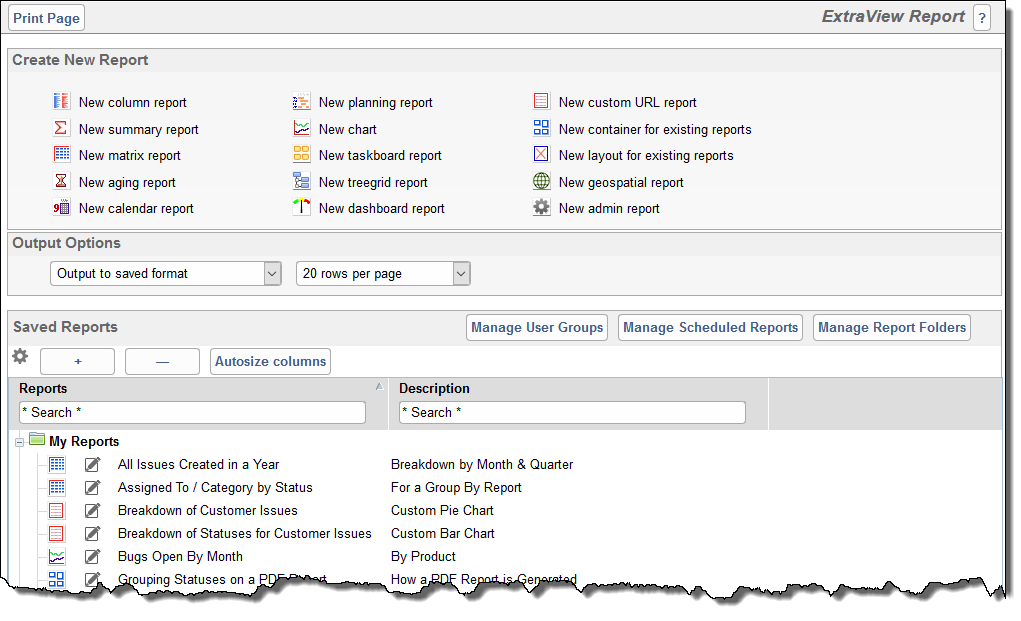
Creating New Reports and Report Options
Only the report types to which the administrator has granted you access will appear. Click on a report type at the top of the screen to create a new report. This takes you to the report editor where you can compose a report before saving it.
You can use the remaining options as follows:
-
Output Options - When you click on a report to run it, the output will appear in the report destination that you have saved within the report editor. The default output option is to use this saved format as the destination. However, you may override this by selecting a different report destination. Note that if the report destination is not the browser, you will see this by holding the mouse over the report title. The help tip will show its default destination. The available output formats are:
-
Browser - the report results will appear in a browser window, using HTML to render the results. This is the default for most report output. Calendar, Dashboard and Planning reports can only output to the browser
-
Text- this outputs the report to text, appearing within a browser window. You can save the text from your browser to a file for further use
-
Microsoft Word - this requires Microsoft Word to be installed on the user's computer and outputs the report directly into a Word document. Note that no images, buttons or links are output with this format
-
Microsoft Word mail label (Merge with uploaded file) - This option allows a Microsoft Word document template (.dotx file) to be uploaded and the output of the report will merge the records into the template. Typically this is used to merge address information within ExtraView issues into mailing labels
-
Adobe PDF (Portrait) - This requires the Adobe PDF Reader software to be installed on the user's computer. The report output will appear within an Adobe PDF window and in Portrait format. Container reports may only be output to Adobe PDF files
-
Adobe PDF (Landscape) - This requires the Adobe PDF Reader software to be installed on the user's computer. The report output will appear within an Adobe PDF window and in Landscape format. Container reports may only be output to Adobe PDF files
-
Microsoft Excel (formatted output) - This outputs the report with basic formatting to Microsoft Excel, which must be installed on the user's computer. Charts cannot be output directly to Microsoft Excel
-
Microsoft Excel (plain output) - This outputs the report with no formatting to Microsoft Excel, which must be installed on the user's computer. Charts cannot be output directly to Microsoft Excel
-
Microsoft Excel (merge with uploaded file) - This outputs the report to a Microsoft Excel spreadsheet. To prepare this output format, a spreadsheet is first uploaded into ExtraView, and ExtraView will send its data to a sheet within the file. Other sheets within the file may manipulate this data and perform any actions of which Excel is capable. Microsoft Excel must be installed on the user's computer. This output option is only available with Column reports.
Not all output options may be used with all report types. This table explains which options are valid, and which options may utilize the report scheduler:
|
Report Type |
Browser |
Text |
Word |
Word
Mail
Label |
PDF
Landscape |
PDF
Portrait |
Excel
Plain
output |
Excel
Formatted
output |
Excel
Merged
Template |
Can
Be
Scheduled |
|
Column Report |
x |
x |
x |
x |
x |
x |
x |
x |
x |
Yes |
|
Summary Report |
x |
x |
x |
|
x |
x |
x |
x |
|
Yes |
|
Matrix Report |
x |
x |
x |
|
x |
x |
x |
x |
|
Yes |
|
Aging Report |
x |
x |
x |
|
x |
x |
x |
x |
|
Yes |
|
Calendar Report |
x |
|
|
|
|
|
|
|
|
No |
|
Planning Report |
x |
|
|
|
|
|
|
|
|
No |
|
Chart |
x |
|
|
|
x |
x |
|
|
|
PDF output only |
|
Taskboard Report |
x |
|
|
|
|
|
|
|
|
No |
|
Treegrid Report |
x |
x |
x |
|
x |
x |
x |
x |
|
Yes |
|
Dashboard Report |
x |
|
|
|
|
|
|
|
|
No |
|
Custom URL Report |
x |
x |
x |
|
x |
x |
x |
|
|
No |
|
Container Report |
|
|
|
|
x |
x |
|
|
|
PDF output only |
|
Layout Report |
|
|
|
|
|
|
|
|
|
No |
|
Geospatial Report |
x |
|
|
|
x |
x |
|
|
|
PDF output only |
|
Admin Report |
x |
x |
x |
|
x |
x |
x |
x |
|
Yes |
-
Rows per Page - This allows you to set the rows per page for the report to use, when output to the browser. This value is remembered once it is set. Note that this option is only used with Column reports and queries that produce a Quicklist report.
The screen also has buttons to allow you to perform the following functions:
-
Manage User Groups - These are informal groups of arbitrary users that you form for a specific purpose. For example, a group of users might be project based and reports may be created and shared amongst the group
-
Manage Scheduled Reports - This provides a single location from where you can manage your personal scheduled reports
-
Manage Report Folders - This function allows you to create, rename and delete report folders.
The gear wheel icon at the top of the report list extends the report display to include all the metadata about each report. Included in the display are:
-
The report type
-
The date of creation
-
The date the report was last updated
-
The user who last updated the report
-
The last date and time the report was run
-
The owner of the report
-
The internal report ID.