This feature works with Column Reports, Treegrid Reports, Summary Reports, Matrix Reports, Charts, Planning Reports and Calendar Reports.
Your administrator will have defined hierarchies for reporting. These allow you to select records at a parent level, and at up to seven child levels for reporting. You may choose to view different fields on a column report for each of the different hierarchy levels, and you may apply different filters to each of the hierarchy levels. In addition, there are functions available that allow you to aggregate the count of the number of issues at each level in the hierarchy.
Note: You must be in the Advanced Query Screen mode to create reports that use reporting hierarchies.
An example of a hierarchy report is that you may want to show a list of all issues by customer, showing details from the Customer business area for each customer, while showing details from the Customer Issues business area for each issue. The following screen shows how this may be set up.
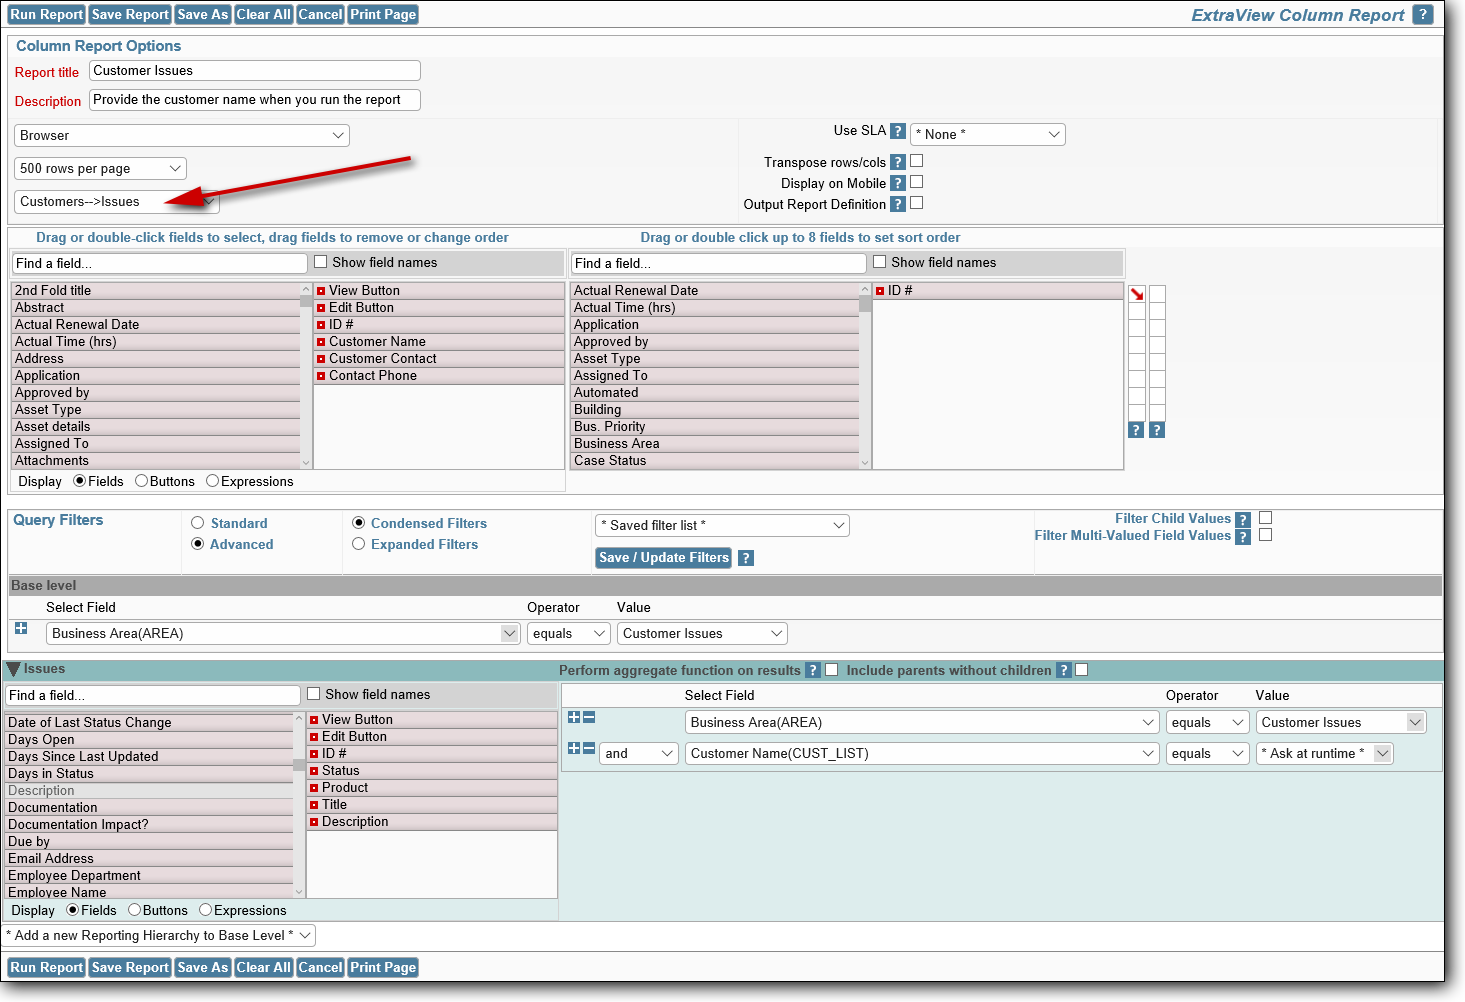
Creating a hierarchical report
First, make certain you are in Advanced Query Mode. Next, you select the hierarchy from the available list of hierarchies within the options section of the report design screen. When you do select the hierarchy, the screen refreshes and you will see a field selection list for each level of the hierarchy, as well as a set of filters to be used for each level of the hierarchy.
The report output will show all the fields selected at all levels of the hierarchy, in the order they appear over all the selection lists.
For each level of the hierarchy, you can apply any filters required for that level in the hierarchy.
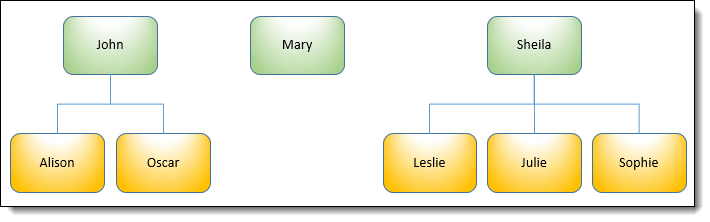
The following options apply to the child levels of the report filters you select. Consider the parents with their children in this diagram:
After following these instructions, you may see a Column report similar to the next screenshot.
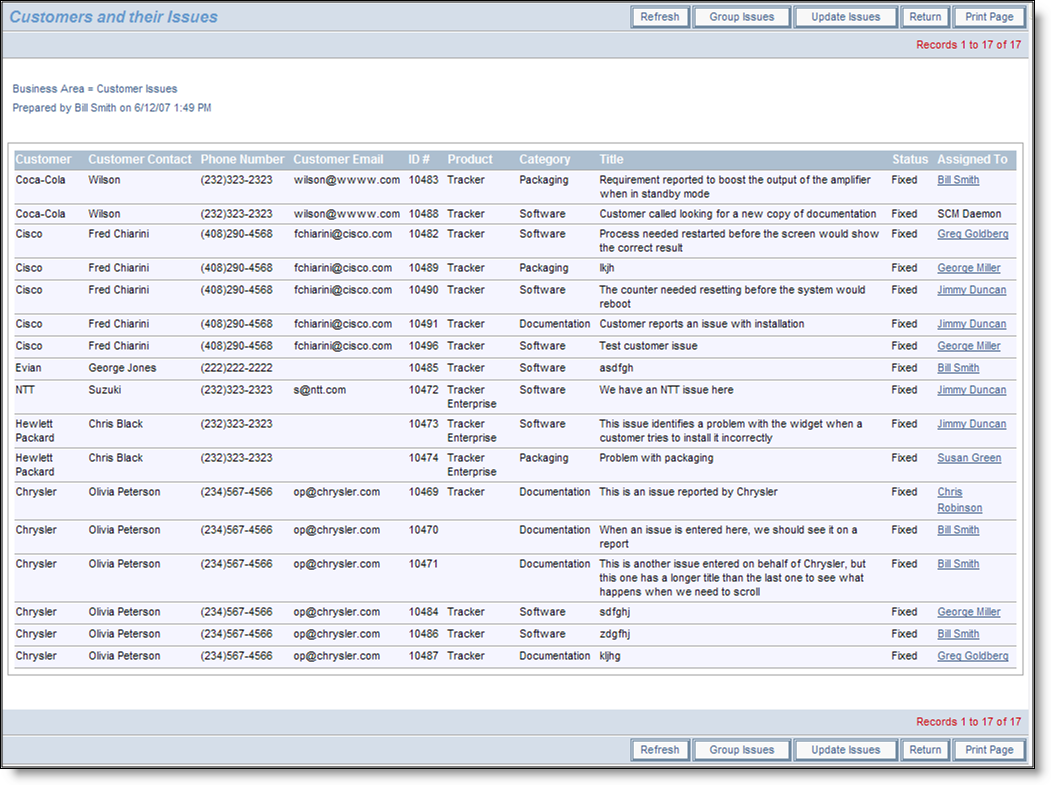
Sample output of Hierarchical Report
Column reports support a special type of hierarchical reporting, called side-by-side hierarchies. Reporting hierarchies are defined with a chain of descending levels, such in ways such as parent, child, and grandchild levels. With side-by-side hierarchies, the user can select multiple, independent hierarchies, all with the same base (top) level, and place the results side-by-side on the report output. For more information, click here.
In the report editor, you can turn on aggregate counting functions for child levels within a hierarchical report. For example, you may want a count of Fixed issues for each customer. This implies that you need to display each customer from the Customers business area and then count the Fixed issues.
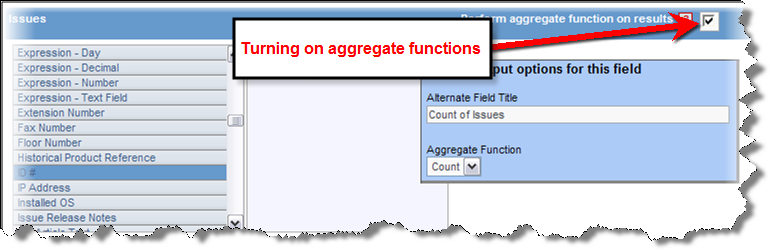
Aggregate functions
This may be achieved by a variant of the above report. First, you check the box against the prompt Perform aggregate functions on results. The list of fields at the child level of the query (in this case the Issues level) will clear. Select a field and you may then use your right-hand mouse button to access the output options for the field. In our example, we can count the ID’s with an additional filter of Status = Fixed to achieve the results we would like to see. This selection process may result in a report something like:
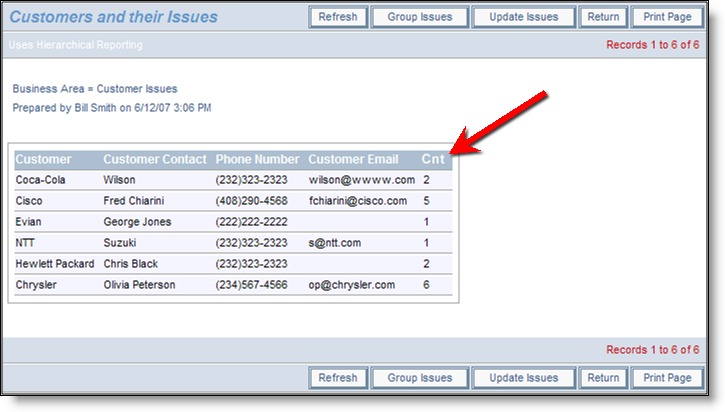
Aggregate report showing count of Fixed issues
The complete list of aggregate functions you can use is:
| Function | Purpose |
| Count | This will count the number of child records within each parent record that match the selection filters |
| Sum | This will sum the total of the numeric value of the child records within each parent record that match the selection filters |
| Min | This will show the minimum numeric value of the child records within each parent record that match the selection filters |
| Max | This will show the maximum numeric value of the child records within each parent record that match the selection filters |
| Mean | This will show the mean of the numeric values of the child records within each parent record that match the selection filters |