The ExtraView reporting feature offers the user a very significant number of different ways to drill down into individual projects and issues and check their status, and to monitor the overall business processes you created. After clicking the Report button on the navigation bar, users have the option of creating and running one of several report types; Column Report, Summary Report, Matrix Report, Dashboard Report, Charts and more. Reports can be created and saved for future use. If the administrator has granted you permission, the reports you create and save can be made available to all users; else the reports can be saved for your own personal use.
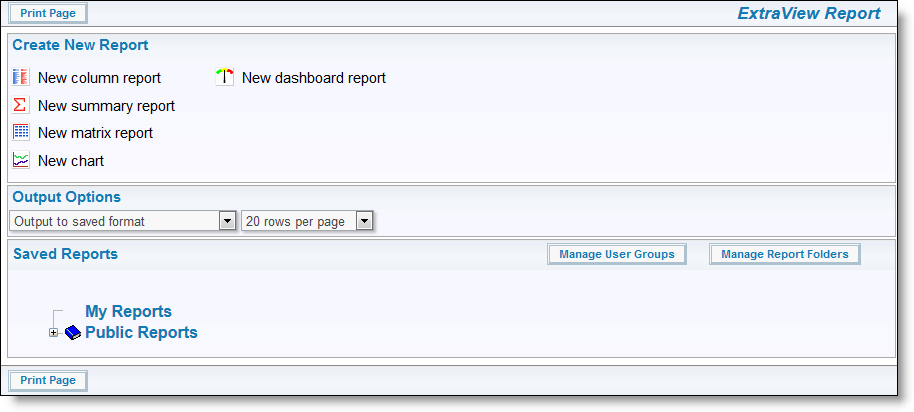
Sample Report screen
Creating New Reports
To create a new report, you have the following report options:
- New Column Report - Select the columns you want to display and which filters to set. The resultant report can be sorted by any of the fields displayed with a single mouse click. For more information regarding Column Reports, please consult our End User Guide
- New Summary Report - When selected, this action creates a report where ExtraView will provide a count of the number of issues under different headings. Using Summary reports, project or area managers can have a snapshot, at any time, of the current overall project status. This sort of information is invaluable for producing internal status reports that are backed by real data. For more information regarding Summary Reports, please consult our End User Guide
- New Matrix Report - When selected, this action creates a report where ExtraView will a results grid with one selected field across the page and one selected field down the page. This report will produce results identical to running a summary report with two selected columns, but rather than the results being displayed in a column, they are displayed in a grid form. For more information regarding Matrix Reports, please consult our End User Guide
- New Chart - Selecting the Create new chart option from the Report screen allows you to create charts of various types. Pie charts, bar charts, stacked bar, area charts and line charts can be built and displayed. Each chart you create may have filters that allow you to select what data is represented. For more information regarding Charts, please consult our End User Guide
- New Dashboard Report - Dashboard Reports are created for the purpose of placing these on user’s Home Pages. Like all other reports, they may be personal or shared. A dashboard report is designed to show summary information. This summary information may originate in a Summary Report, a Matrix Report, an Aging Report or a Chart. For more information regarding Dashboard Reports, please consult our End User Guide
Accessing Saved Reports
The EvStarter solution comes with a number of pre-built reports. Of course, as many reports as are needed may be built easily. This list will suffice as a good start point, but please note that your administrator may have altered or added to these reports. For more information about using these reports, or creating custom report options, please consult the End User Guide or the Administration Guide.
To access the default and saved reports, simply expand the section entitled Public Reports. Once expanded, the options Dashboard Reports, General Reports, Bug Tracking Reports, and Helpdesk Reports are presented.
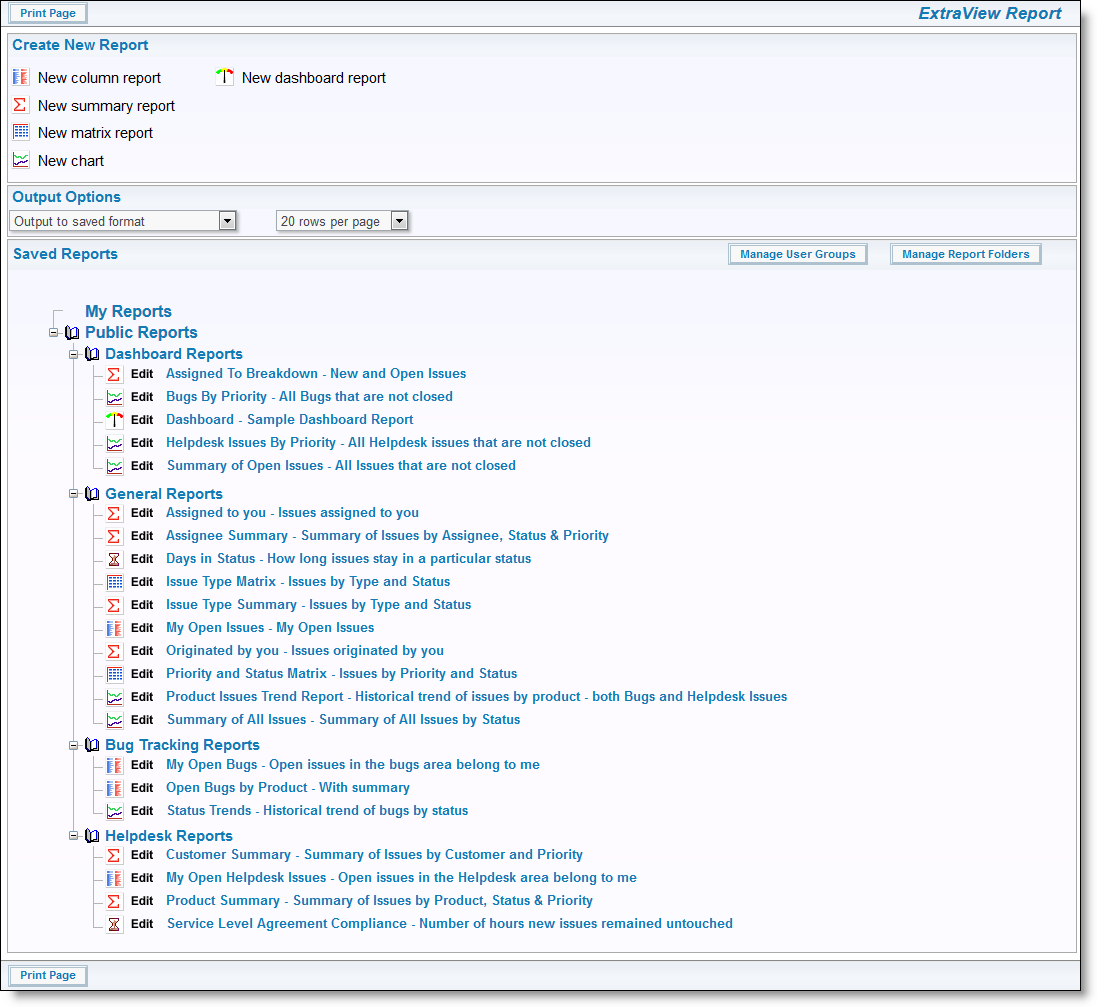
Report screen
Click on the links to access and run the report. You also have the options to edit and save these reports as needed.