When selected, this action creates a report where ExtraView will a results grid with one selected field across the page and one selected field down the page. This report will produce results identical to running a summary report with two selected columns, but rather than the results being displayed in a column, they are displayed in a grid form. Examples of useful matrix reports include:
You are able to select from any fields to which you have read permission, and which are able to be summarized. For example, you can typically summarize on different values in a list, but cannot summarize on text fields. To prepare a new Matrix report, choose the Create New Matrix Report option. The screen presented to you will be similar to the following:
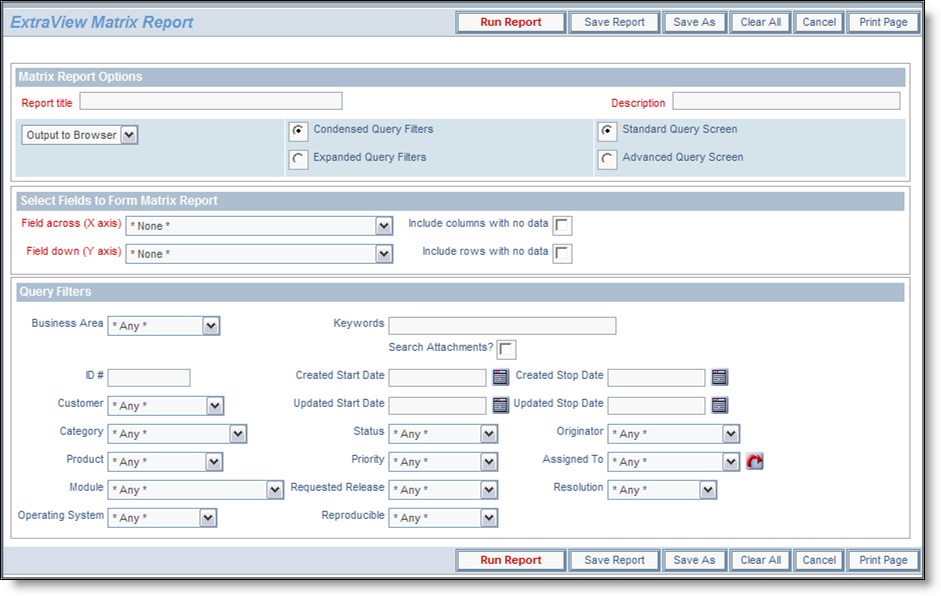
Creating a new matrix report
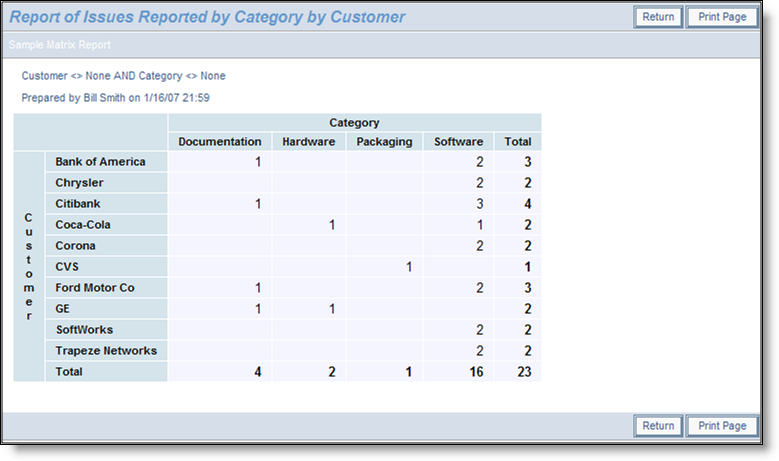
Sample matrix report
Date fields are stored within ExtraView, with the time component accurate to the nearest millisecond. Therefore, if you want to prepare a report using a date field, you should recognize that the count of issues with the identical date is likely to be one! This may be a little surprising at first, but it is accurate. ExtraView provides alternative methods for summarizing on date fields, so you can answer questions such as “How many issues were opened by each support technician on a given day”? Inbuilt date fields such as “Date Created” have an alternative form, which is the truncated version of the date, i.e. with no time component. If your administrator has given you access to these, then summarizing on this will give a total account within a day. Also, if your administrator configured a date field such that the time component is ignored, then the fields will summarize by the complete day.
If you summarize on a normal date field, the behavior also depends on your personal time format, stored within your personal information. If you have a date format that includes the time within the day, the report will most likely show you a single row for each date entry, with a count of 1. The date displayed on each row will show the time. If your personal date format does not include time, then all the date values are consolidated onto a single label for all the rows of the report, and you will still see one row for each date within the report.
If your administrator has defined hierarchies on which you can report, you will see an additional prompt on the report editor screen:
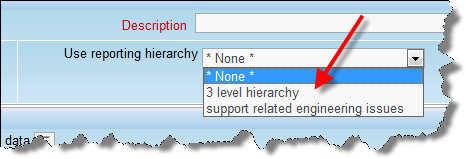
Reporting on hierarchies within matrix reports is similar to the way they are defined for column reports. The key difference is that you are only required to select the filters for each level in the hierarchy. These filters will be applied to each level of the hierarchy for the preparation of the data to be placed on the report. The report output will look very similar to a standard matrix report, except that the additional filters are applied.