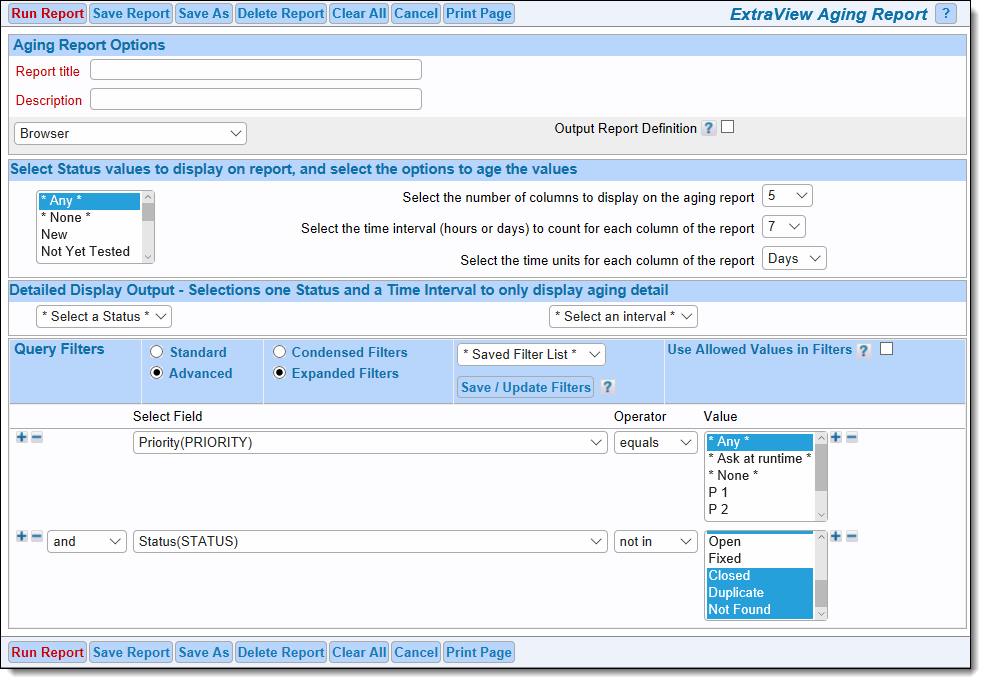
If you choose the Create new aging report from the Query / Reports screen offers a variety of aging reports, designed to show how long issues have remained in various statuses as the issues were progressed from stage to stage. The aging report produces a count of issues that have been in each status for a defined period of time. These reports are offered at multiple levels as discussed below. When you select this option, you will see the following screen:
Creating an aging report
The Aging Report options are the same as for Column and Summary reports. Likewise, selecting filters is the same as for other report types. The specific information required for aging reports is collected in the center sections of the report editor.
This section sets up the report output, providing a summary report with the details available as drilldowns from the output.
| Status List | This presents all the statuses available, and you may select the statuses you want to display on the aging report, when you run the report |
| Select the number of columns to display on the aging report | This option allows you to decide how many columns you want to display on your aging report. The default is five columns, but you can choose any number from one to one hundred |
| Select the time interval (hours or days) to count for each column of the report | This sets how long each period of the aging report is. For example, if you select the default value (seven) you are choosing either seven hours or seven days for the aging period, as further defined by the next option. The maximum for this selection is thirty-one, allowing for a breakdown by days over one complete month |
| Select the time units for each column of the report | In conjunction with the time interval, this selects whether you are aging the information in either hours or days. The default value of days, used with the other default options, results in an aging report with five columns, each representing one week in time |
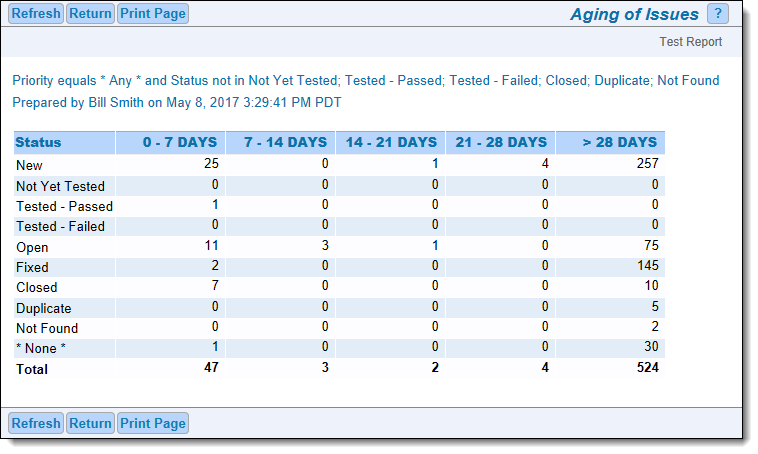
There is a button to the right of the Report Title that appears when you are editing an existing report. When you place your mouse over this button, you will see who created the report, who last updated the report and the dates when these actions occured. This is most useful for managing public reports. When you have selected the options and pressed the button to run the report, the output will look similar to the following:
Aging report display
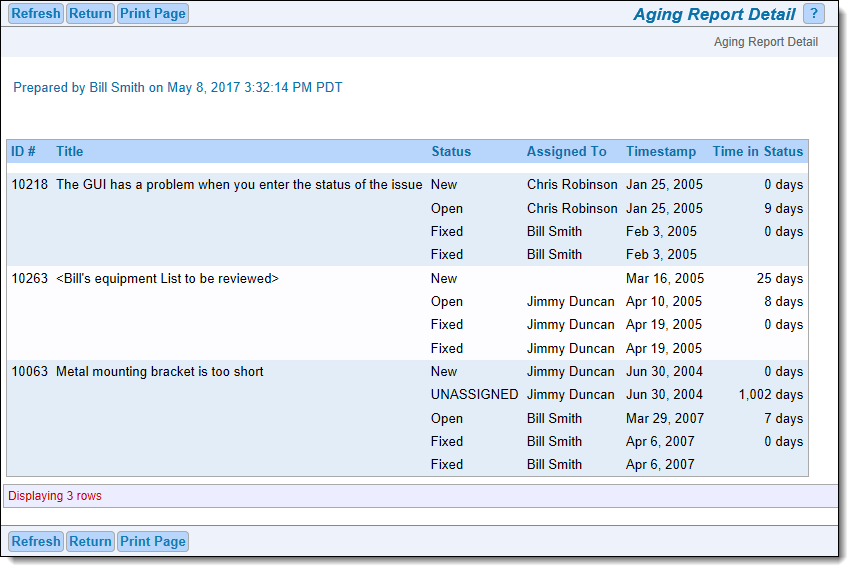
As you can see from the sample, the report displays each of the statuses selected, along with a count of the number of issues that have been in that status for the different time intervals on the report. Each of the counts is a link to the issues that make up the count. Clicking on the number drills down to a further report that gives a history of the time the individual issues spent in each status as shown in the following diagram. Note that incomplete days are not counted in the aging. Similarly, if your report is based on an hourly drilldown, then incomplete hours are not counted.
Drilling down into an aging report
From this report, you can drill down again, by clicking on the issue ID #. This results in the Detailed Report for the issue being displayed.
It is optional to select entries in this section of the report editor. If you do, then the summary output is skipped and you are provided with the above screenshot, for the Status and Time Interval you select.