When selected, this action creates a report where ExtraView will provide a count of the number of issues under different headings. Summary reports can be saved as personal or public reports. Examples include:
Using Summary reports, project or area managers can have a snapshot, at any time of the current overall project status. This sort of information is invaluable for producing internal status reports that are backed by real data.
You are able to select from any fields to which you have read permission, and which are able to be summarized. List values are those which are most commonly summarized. To prepare a new Summary report, choose the Create New Summary Report option. The screen presented to you will be similar to the following:
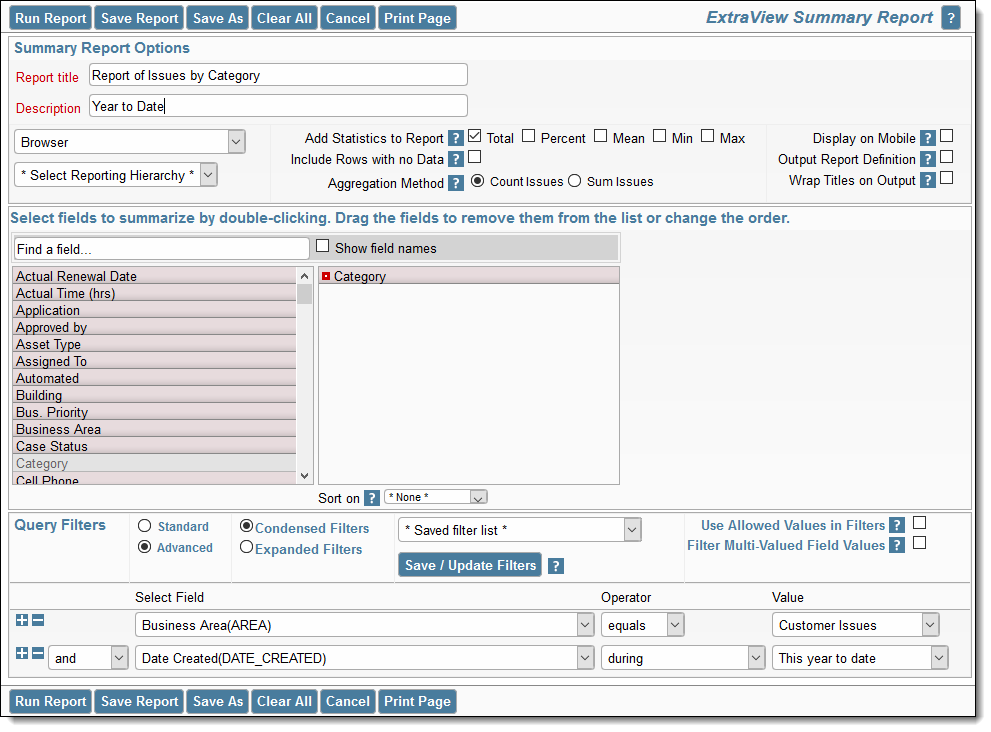
Creating a new summary report
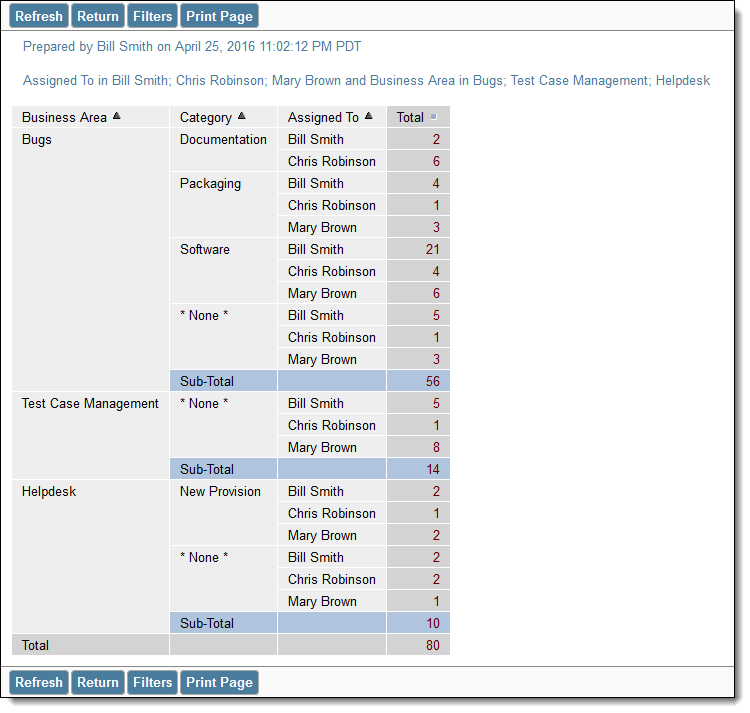
Sample summary report 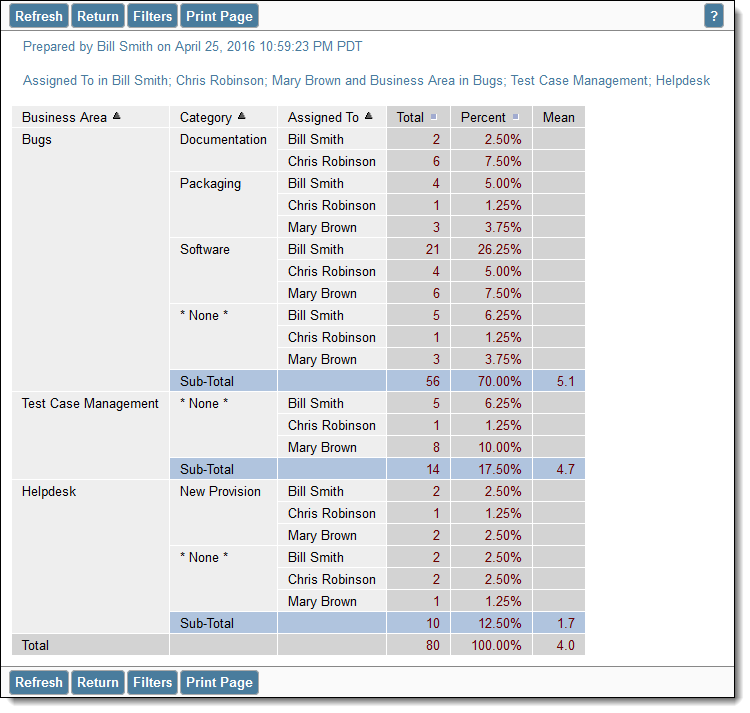
Sample summary report with statistics
By default, the width of columns on browser output are not set, and the user's browser determines the width of each column using its own algorithms. Most of the time, this works well, but there are times when you might want to more accurately fix the width of the Y axis titles being displayed on the output. Right-click on the red button by the field name you selected for the report, and one of the fields allows you to set the width of the column, measured in pixels. This number is approximate, as browsers will sometimes override the number you set, particularly if you are displaying a large number of columns on the screen, relative to the width of the screen. Microsoft Word and PDF column width output are set using the same option. Note that you may also use the report option titled Wrap Titles on Output to assist in controlling the width of columns on the output. When you both set the width of a column and set the Wrap Titles on Output option, the column width setting takes precedence.
If you prepare a summary report, and include one or more fields from the repeating record as any the fields that is to be summarized, then it is possible (indeed probable) that an individual record will be summarized into more than one line of the summary report that is displayed.
This works without problem, and you can drill down from an individual line of the report to see the issues that made up the total for the line. The totals for the displayed summary report will be accurate totals of the lines of the report. If you drill down into the total and grand total lines of the displayed summary report, the issues that were included on different lines of the summary report are not repeated as this would be confusing. However, this does lead to the possibility that there will be fewer issues on the drill-down report than appear in the total of the summary report.
For example, you may see a grand total of 135 issues on a summary report, but when you drill down into this total, there may only be 125 issues displayed. This probably indicates that 10 of the issues rightfully appeared in two rows of the summary report.
Date fields are stored within ExtraView, with the time component accurate to the nearest millisecond. Therefore, if you want to summarize on a date field, you should recognize that the count of issues with the identical date is likely to be one! This may be a little surprising at first, but it is accurate. ExtraView provides alternative methods for summarizing on date fields, so you can answer questions such as “How many issues were opened by each support technician on a given day”? Inbuilt date fields such as “Date Created” have an alternative form, which is the truncated version of the date, i.e. with no time component. If your administrator has given you access to these, then summarizing on this will give a total account within a day. Also, if your administrator configured a date field such that the time component is ignored, then the fields will summarize by the complete day.
If you summarize on a normal date field, the behavior also depends on your personal time format, stored within your personal information. If you have a date format that includes the time within the day, the report will most likely show you a single row for each date entry, with a count of 1. The date displayed on each row will show the time. If your personal date format does not include time, then all the date values are consolidated onto a single label for all the rows of the report, and you will still see one row for each date within the report.
It can be useful when displaying a summary report to only display the most significant results. For example, a summary report may display 100 rows, but you might only be interested in the ten rows with the highest values. To achieve this, there is filter that is normally used in conjunction with the advanced query mode, titled Top-n rank filter. For the above example, if you set the filter to Top-n rank filter less than or equal to 10, then only the ten highest values will be displayed. If you set the filter to be Top-n rank filter equal to 3 only the third highest value will be displayed. Note that this feature is not supported on all databases.
If your installation is utilizing MySQL or Apache Derby as its underlying database, then this feature is inoperable.
If your administrator has defined hierarchies on which you can report, you will see an additional prompt on the report editor screen:
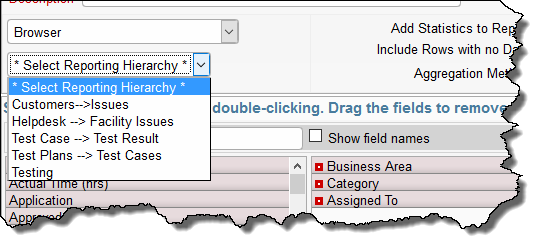
Reporting on hierarchies within summary reports is similar to the way they are defined for column reports. The key difference is that you are only required to select the filters for each level in the hierarchy. These filters will be applied to each level of the hierarchy for the preparation of the data to be placed on the report. The report output will look very similar to a standard summary report, except that the additional filters are applied.
This feature produces a standard summary report for the output, but allows you to group the results using filters at each level of the report hierarchies.
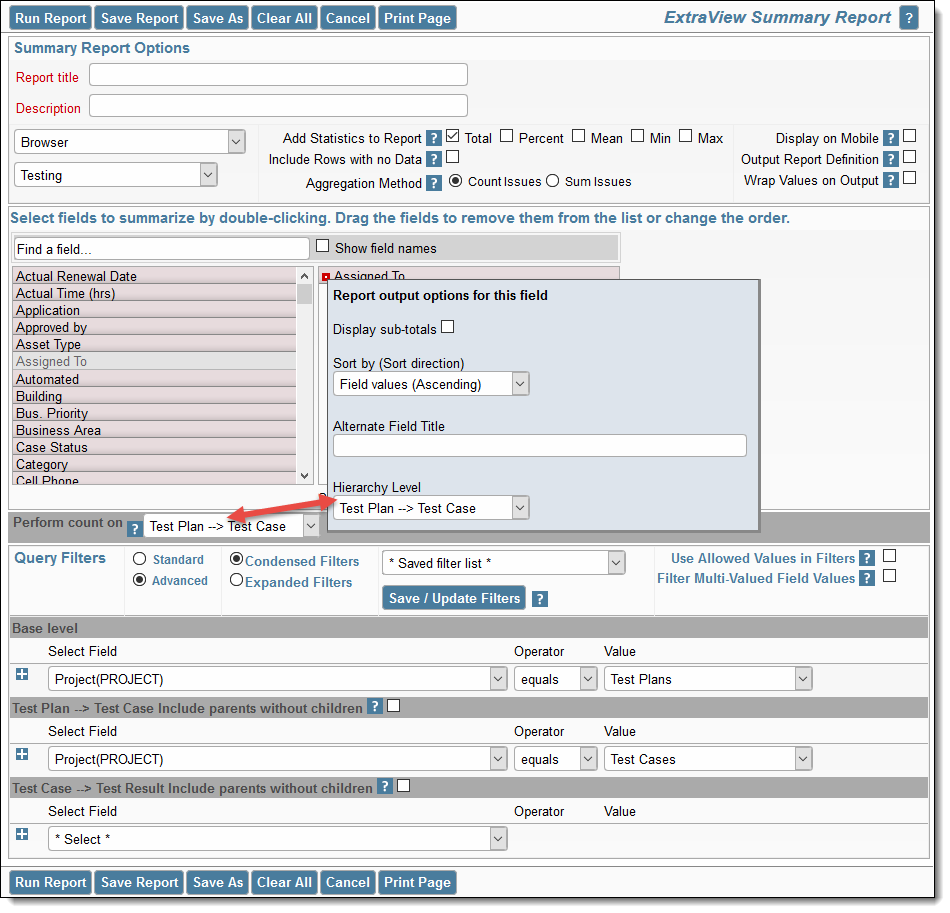
To prepare and run a summary report that groups on multiple levels of hierarchical filters, perform the following steps: