Taskboard reports are designed to offer a matrix of issues on a display. The axes may be any enumerated list type field. For example, you might have Assigned To on one axis and Status on the other axis. Issues are displayed within tiles on the report output. You decide which fields are to be placed on the report, both in a title area, and within the description area of the tile. The key attribute of the taskboard report is that you can drag individual tiles from one location on the report, to a different area. Using the example above, this means you can drag an issue with a specific Assigned To value and a specific Status value and drop it on another area of the report, thereby updating either the Assigned To or Status value, or both values at one time.
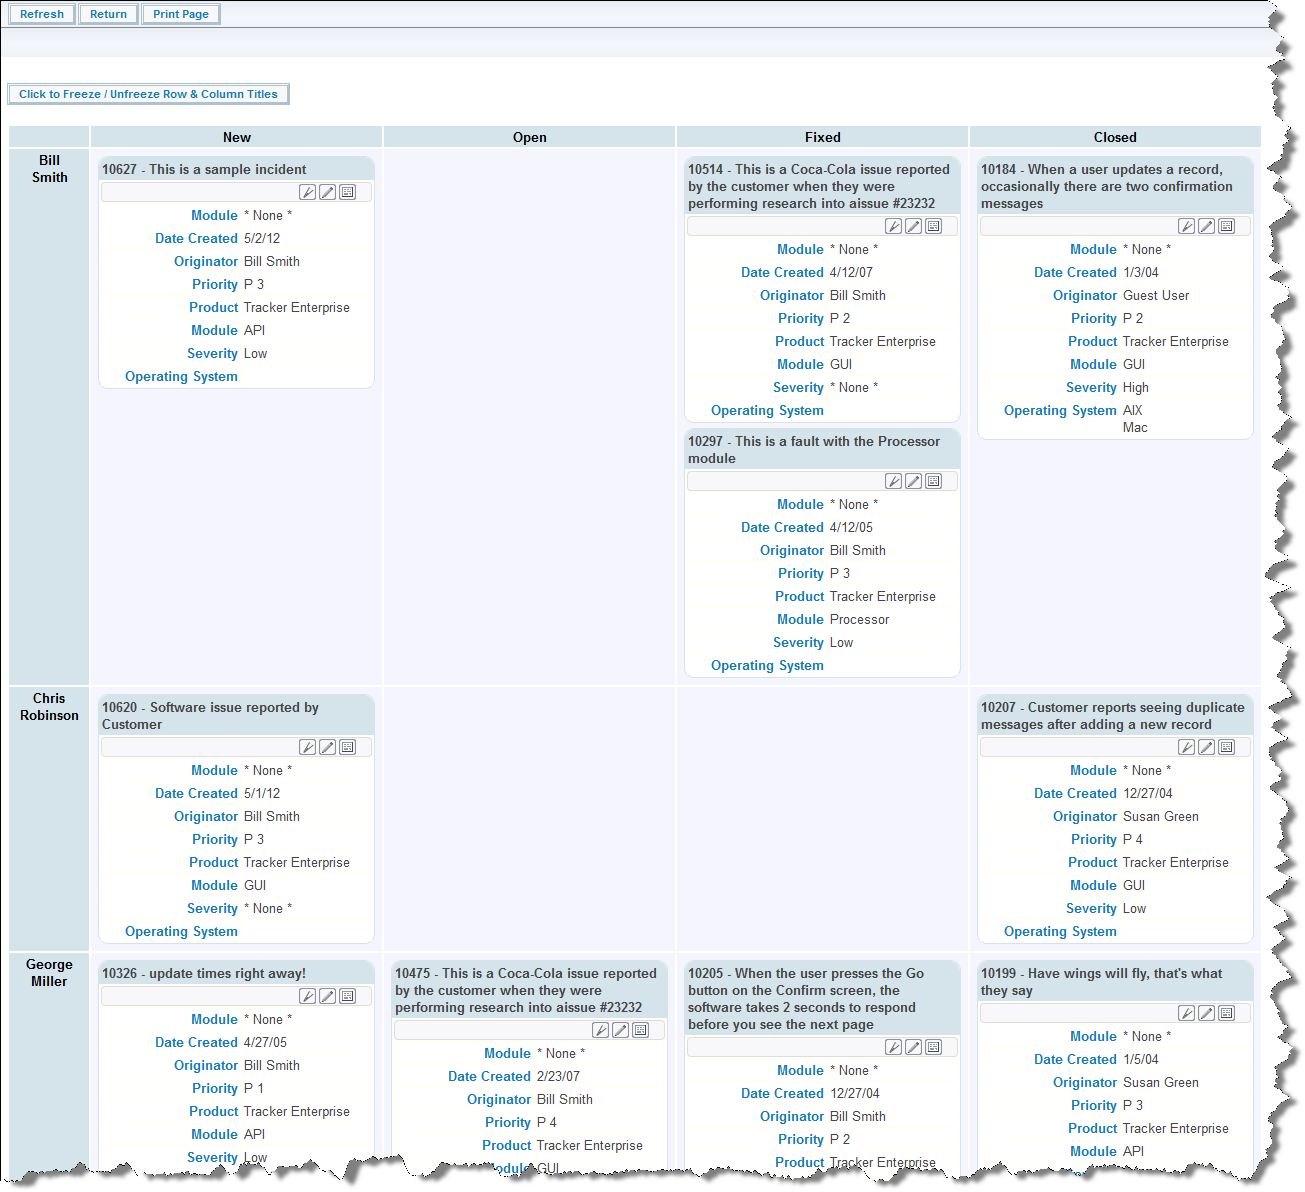
Taskboard Report Output
With the above screenshot, you can use your computer's mouse to drag the issue represented by the tile in the top left-hand corner of the report and drop it elsewhere. This issue has values of Bill Smith for the Assigned To and New for the Status field. When you drop the issue in another row and column, the values for the Assigned To and Status are immediately updated to those of that row and column. If the update triggers additional rules, then a popup window appears, asking for values to satisfy these rules. For example, you might need to provide a Comment when you update an issue's Status from Open to Fixed, so the popup would ask you for a value for the Comment field.
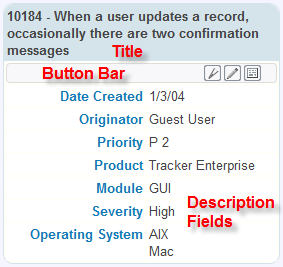
Taskboard Tile
The Taskboard Report Editor
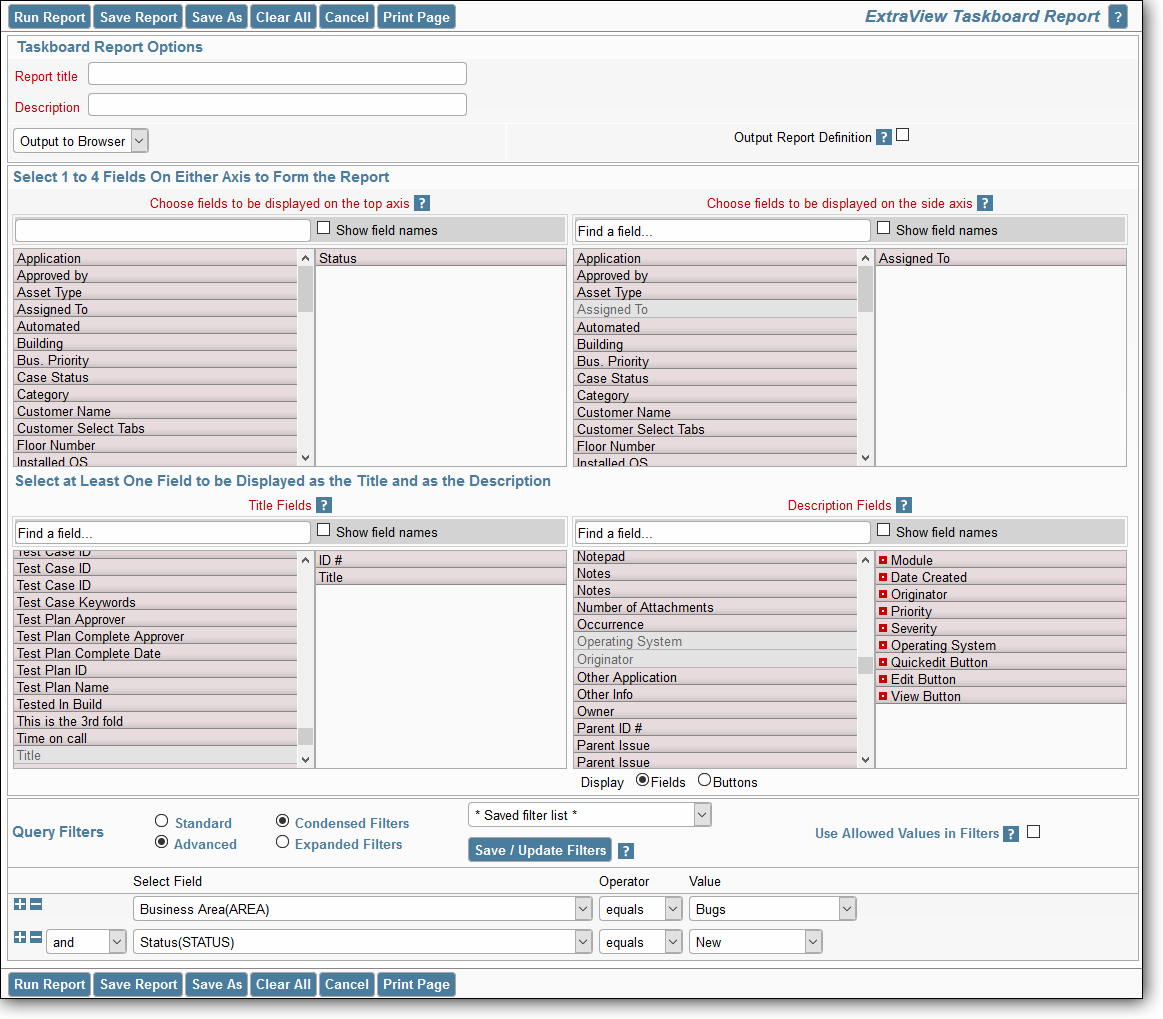
Taskboard Report Editor
-
Provide a title for the report
-
Provide a description for the report
-
Note that the only valid output option is your browser
-
Like all other report types, you may use Condensed or Expanded query filters
-
Like all other report types, you may use the Standard or Advanced query mode
-
You may select a reporting hierarchy for the filters. When you choose a hierarchy, you will see query filters for each level of the hierarchy
-
Select from one to four fields to use to set the top axis of the report. The valid fields to choose from are all of the various list types within your installation. When you choose more than one field for the axis, you will see the tiles will appear on the report output within new sections that are created within each field. Note that multi-valued list fields may not be placed on axes
-
Select from one to four fields to use to set the side axis of the report. The valid fields to choose from are all of the various list types within your installation. When you choose more than one field for the axis, you will see the tiles will appear on the report output within new sections that are created within each field
-
Choose the fields to display within the title of each tile. Typically you will only choose one or two fields such as the issue ID and the Title of the issue
-
Choose the description fields to place within the body of each tile on the report output. Note that you may also choose various buttons to place on the output. All the buttons you select are gathered together and placed in a mini-button bar under the title of each report tile
-
Choose the filters for your data. It is possible to create a vast number of cells on your report output if you do not provide reasonable filters for the data. Your administrator will have set some limits as to how many tiles you can place on a report. Obviously, a report that has tens of thousands of tiles becomes unworkable and virtually impossible to navigate
-
In the usual way, run or save your report
Editing Fields on a Taskboard Tile
There are several ways in which you can alter values within a Taskboard tile. In order to be able to edit an issue, you must have permission, and in order to be able to edit a field within an issue, you must have permission to write to that field:
-
Drag the tile and drop it within a different row and column of the report. This will update the values within the issue to those that appear on the title of the row and column
-
Double-click on a field within the description area of a tile. This allows you to update a single value within the field on the tile. Note that if this field is also a field on one of the axes of the report, then the tile will be moved to the appropriate row and column of the report. If you use double-click to initialize the edit operation, you use the enter key within a text field to complete the edit. With a list field you simply select the new value. If you want to cancel your edit, then use the Escape key on your keyboard. The report will not allow you to edit values that are read-only, or fields to which you do not have write permission
-
Use the Quickedit button to allow the editing of all the fields on the tile at one time. You will also see an Update and Cancel button appear within the button bar as controls. Note that you cannot use Quickedit on more than one tile at a time
-
Use the Edit button on the button bar to enable a popup window with the entire record available for editing and updating.