Double group by layouts are prepared by first designing a summary field, with two fields selected as the object of the summary list. For example, you may prepare a Summary report using the Assigned to and the Product fields. Any filters may be applied to this report.
To prepare a Double Group By layout report, choose the Create layouts for existing reports from the Query / Report Options list and press the GO button. After pressing the radio button Double Group By Report at the top of the screen, you will see the following:

Preparing a double group by report
To prepare the report:
 button. When you hold your mouse over the button, you will see a summary of the style that is set. When you click on this button, you will see a pop up window where you can set the style
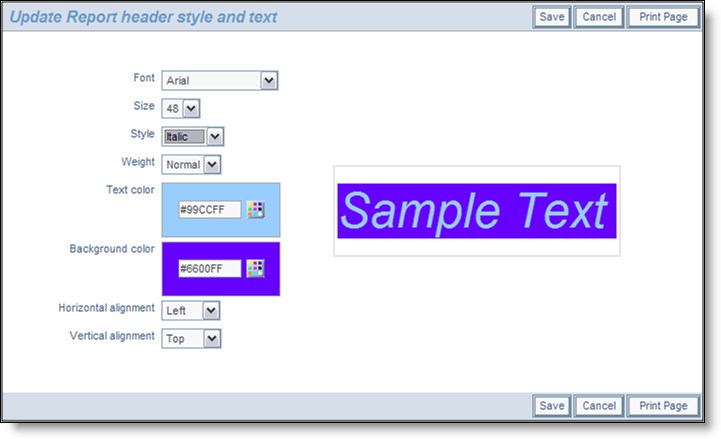
Setting the style of an element on a PDF report
First create and save a summary report. For our example, we create a Summary report with both Assigned To and Status selected.
Now we will place this report onto the layout:
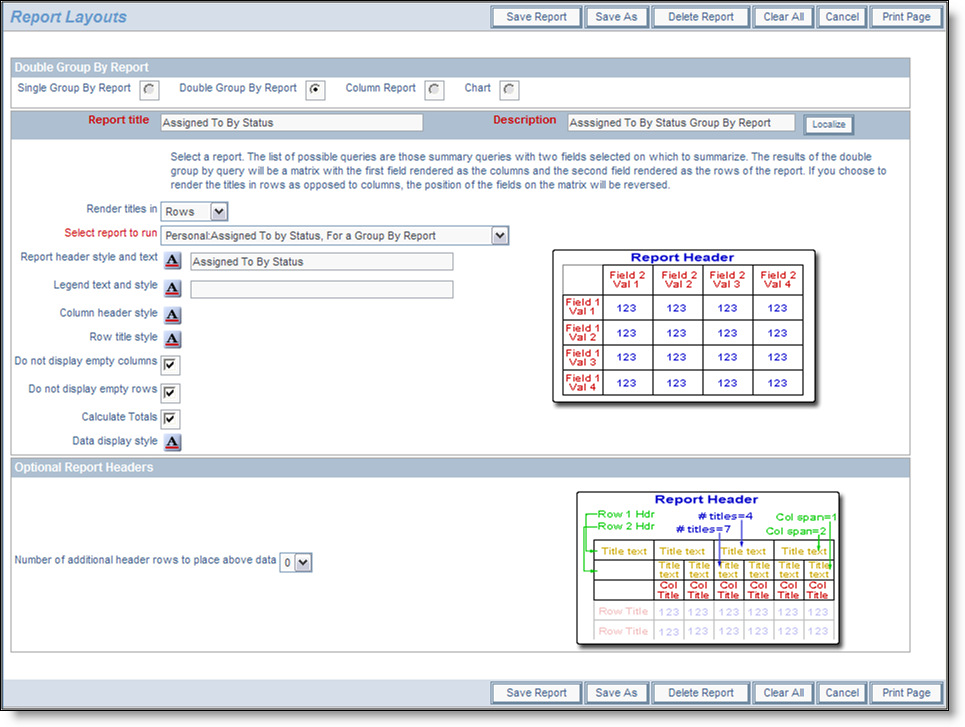
Sample Double Group By Report
Notice how we supplied the report to run as Assigned To by Status as the report to group the results in a matrix form. If we add total, and some style information, then save the report, then include into a container report, and run the container report, we will see results similar to this:

Sample Double Group By Report