Control charts (cCharts) are viewed as one of the Seven Basic Tools of Quality (Reference - Montgomery, Douglas (2005). Introduction to Statistical Quality Control. Hoboken New Jersey: John Wiley & Sons, Inc.). Control charts are used to help identify if business and/or manufacturing processes are currently under control, and to also predict future performance. If the process if out of control, the chart can be used to help identify areas that require further analysis.
The ExtraView documentation is not intended as a thorough treatise on the use and interpretation of control charts. The user is expected to be familiar with the concepts and to understand the topic.
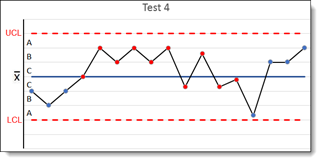
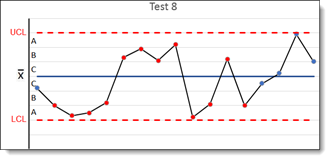
A control chart renders 3 horizontal lines which indicate the Upper Control Limit (UCL), the Lower Control Limit (LCL) and the Mean (![]() ). The UCL is +3σ from the Mean line and the LCL is -3σ from the Mean line.
). The UCL is +3σ from the Mean line and the LCL is -3σ from the Mean line.
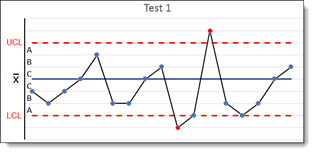
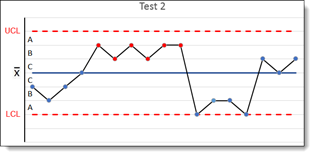
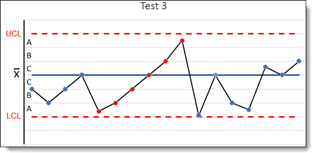
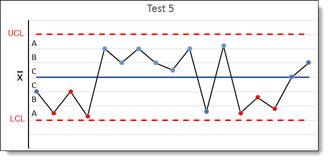
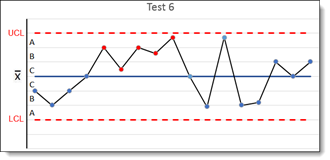
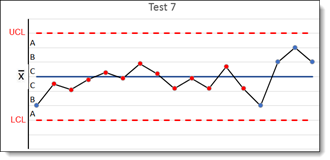
Visible indicators are used to identify data points that signal areas of concern. Points on the chart that are deemed to be behaving in an unusual way are referred to as Special Cause points. These points are colored red.
There are up to 8 tests that can be used to identify Special Cause points. Any combination of tests can be selected and any integer can be set as the test condition for that test. The conditions referenced below are examples and are not necessarily considered to be standard default values. Examples of the use of control charts with these tests are:
The time-based control chart allows the user to select a date field to be used and displayed on the x-axis. In order to create a new time-base control chart, choose the Create New Chart Report option and then choose Time-based Control cChart as the chart type. Follow the steps corresponding to the labels on the screenshot below:
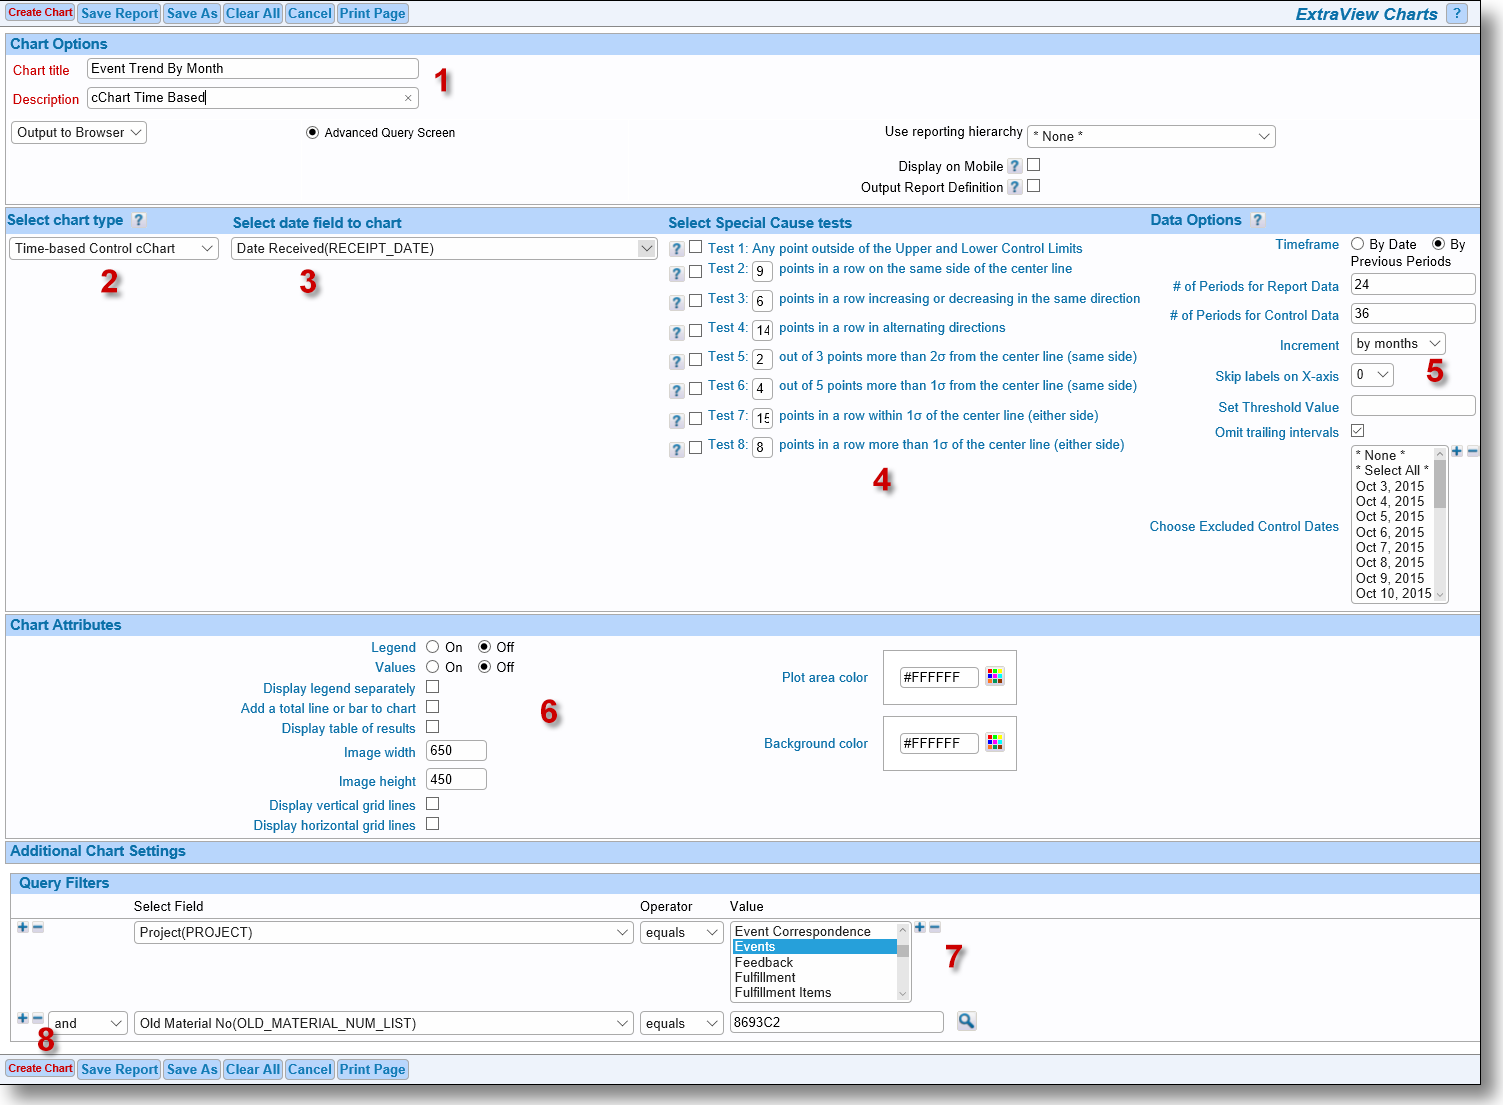
| 1 | Chart Options - Enter the title and descriptions for the chart |
| 2 | Chart Type - Select the Time-based Control cChart option |
| 3 | Date Field to Chart - Select from a list of the date fields presented in the list |
| 4 | Select Special Cause tests - These options provide the flexibility of specifying the number of points required for each special cause rule. Defaults are provided for the values of the special cause tests and the user may select different values. To turn on one of the tests, check the box at its left. This step highlights points visually on the chart that violate the rules you require. An understanding of cCharts is important when altering the values for these tests |
| 5 | Date Options - The available options in this section are:
|
| 6 | Chart Attributes - These are the common chart attributes used to embellish the display of all charts |
| 7 | Query Filters - Select the approriate filters to be used to select the data set being used to compute the results |
| 8 | Create Chart - Click the button to produce the control cChart. |
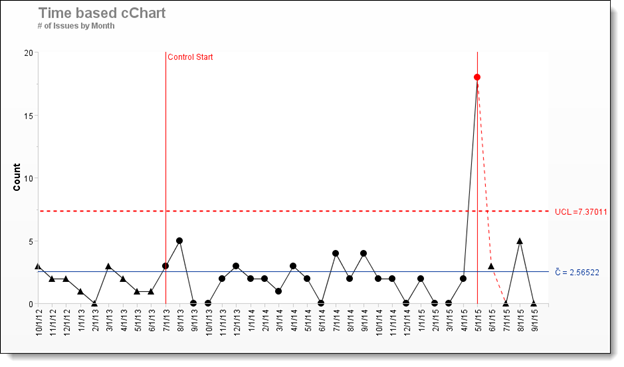
A sample time-based control cChart is shown here:
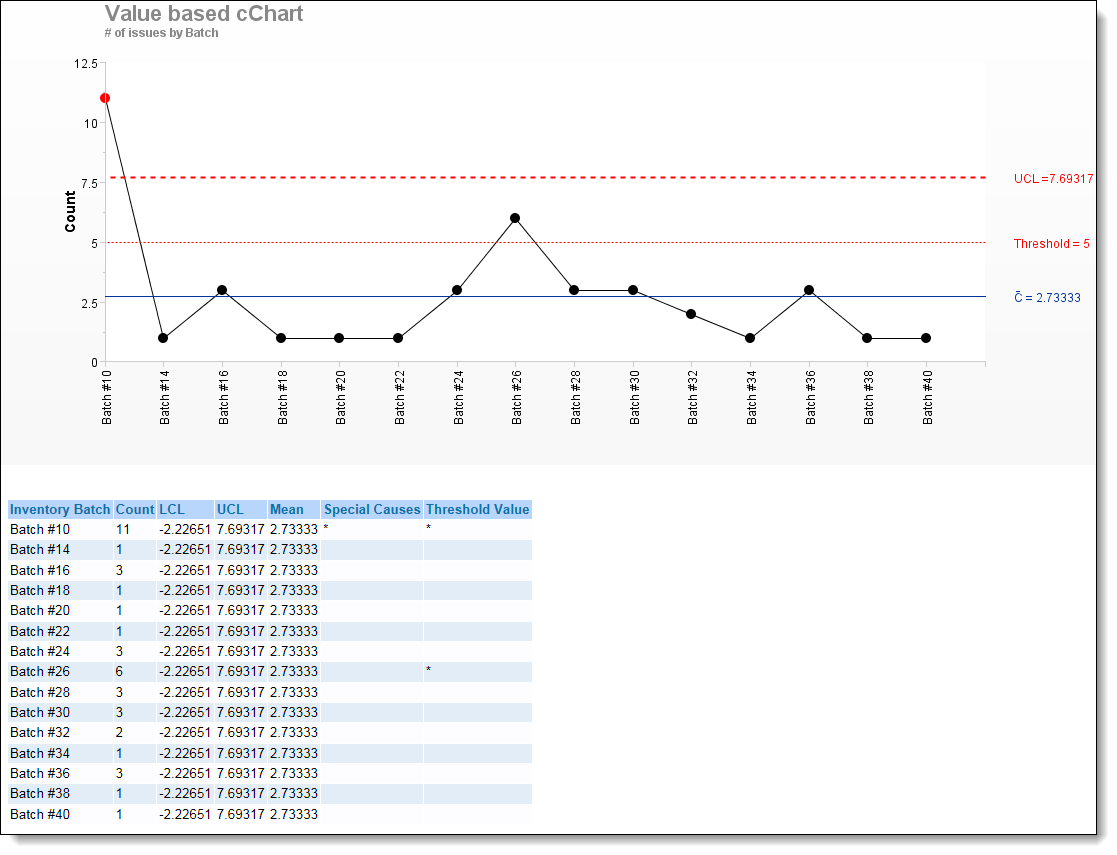
Value-based control charts allow the user to select an enumerated type field to be used on the x-axis. This differs from time-based control charts where a date field is used as the x-axis.
Value-based control charts are set up in a similar fashion to time-based control charts. The key difference is that you choose an enumerated field such as a list field to display on the x-axis. You do not need to enter any date range information. The typical output of a value-based cChart is as follows. The screenshot also shows how a table of results may also be displayed.
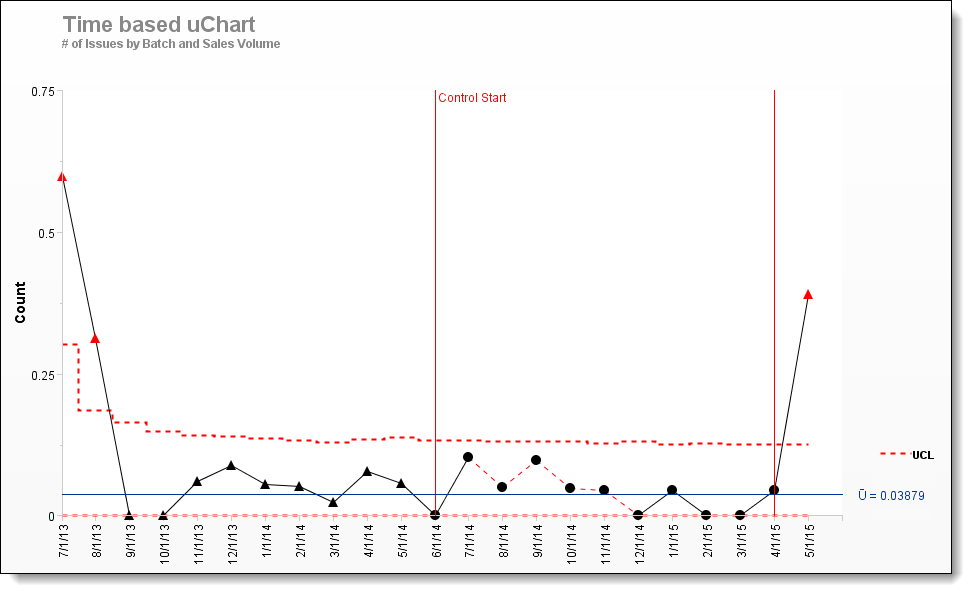
uCharts are a type of control chart used to monitor "count"-type data where the sample size is greater than one, typically the average number of nonconformities per unit. Time-based control uCharts are used if the same sample size is variable. uCharts allows the user to select a date field to be used on the x-axis. They chart records over time in relation to a volume amount.
uCharts differ from cCharts in that they account for the possibility that the number or size of inspection units for which nonconformities are to be counted may vary. Larger samples may be an economic necessity or may be necessary to increase the area of opportunity in order to track very low nonconformity levels.
Preparing a Time-Based uChart is similar to creating a cChart. The differing options are:
A sample time-based uChart look like the following screenshot: