Dashboard Reports are created for the purpose of placing these on user’s Home Pages. Like all other reports, they may be personal or shared. A dashboard report is designed to show summary information. This summary information may originate in a Summary Report, a Matrix Report, an Aging Report, a Chart or a Custom URL report.
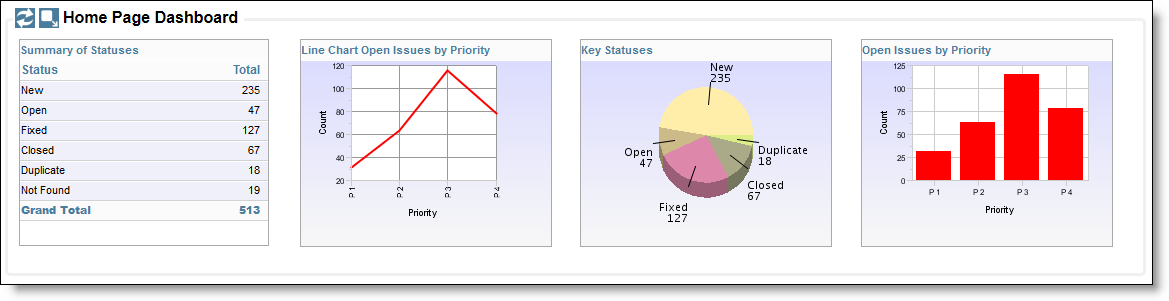
A typical Dashboard Report
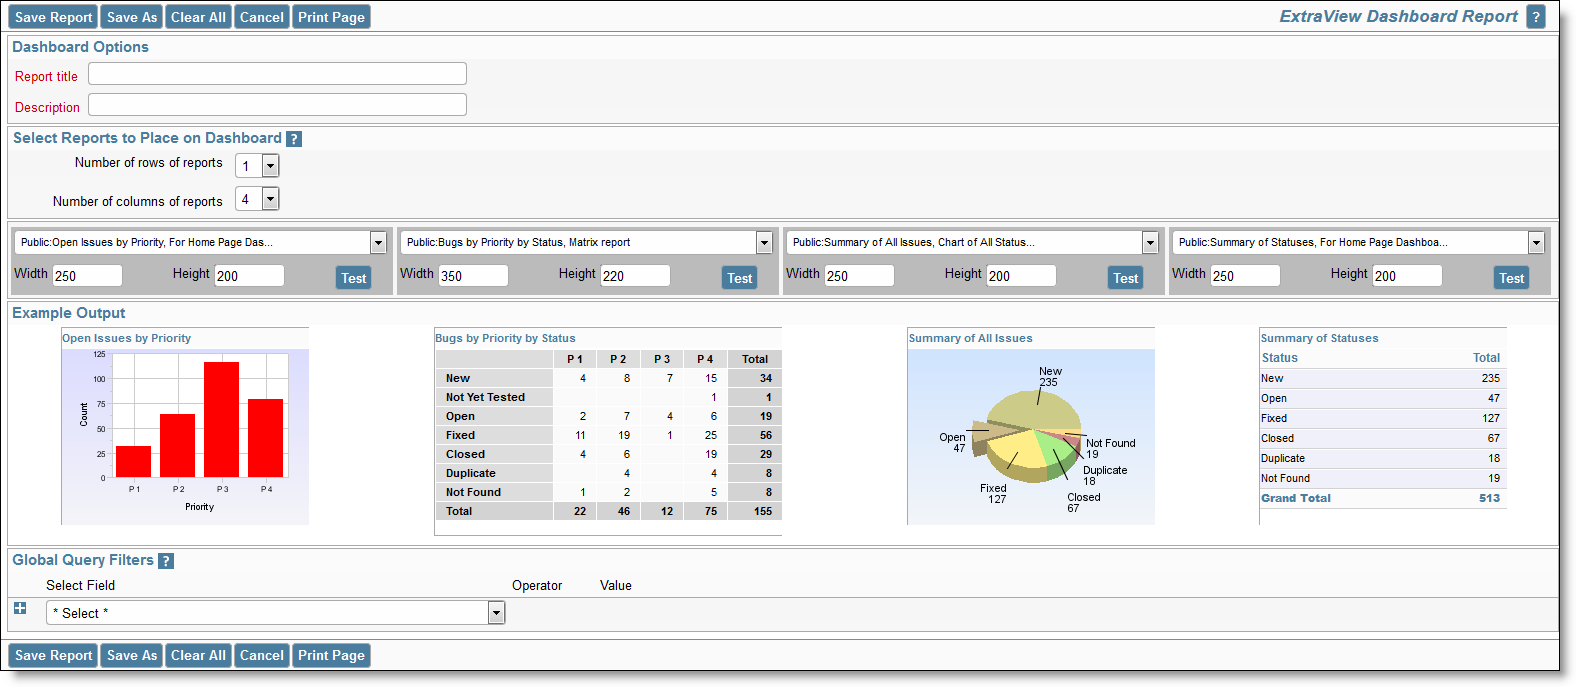
You may place up to 10 individual reports on a Dashboard Report, up to 10 horizontally, and up to 10 vertically. Care should be taken when designing a Dashboard Report, to ensure that you place these in a readable fashion and that you do not try to place too much information on the dashboard. To create a new Dashboard Report, choose the option Create new dashboard report from the list of new report types on the Query screen and press the Go button. You will see a screen similar to the following:
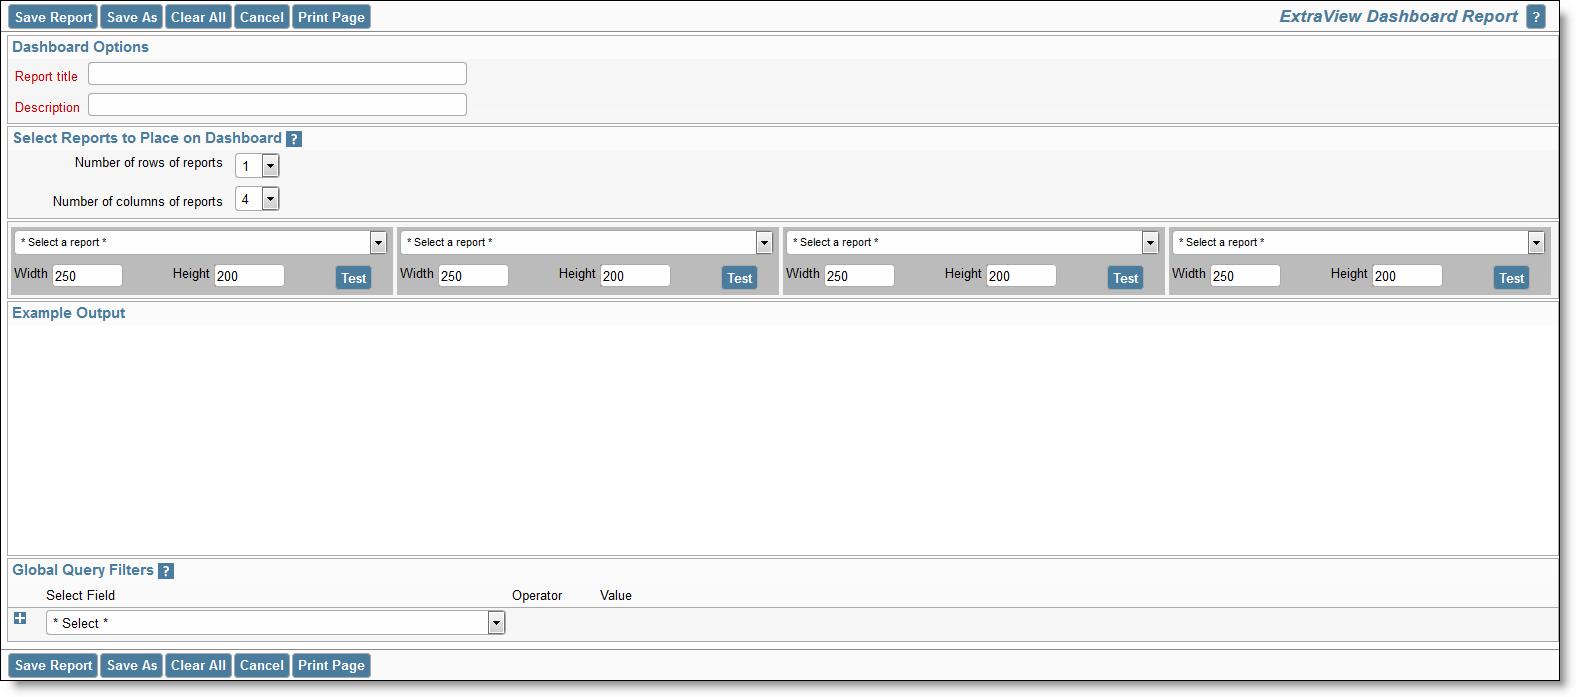
Creating a new Dashboard Report
Like all other reports, you may set the report title and description. Note that the report title will be displayed as the title to the entire dashboard report when it is placed on your Home Page. You can alter the number of rows and columns of the reports contained in the dashboard report at any time, when first creating or when editing a dashboard report. When editing a report, there is a button to the right of the Report Title. When you place your mouse over this button, you will see who created the report, who last updated the report and the dates when these actions occured. This is most useful for managing public reports. The reports that may be placed on the dashboard report are placed in select lists; you may alter the display size of any report by using the Width and Height options. These are measured in pixels. Note that you should not exceed the width of the window for your dashboard reports. The overall default size is set by the administrator, and is typically around 1,000 pixels. The Test button allows you to run the report and place it on the dashboard so you can check for the presentation.
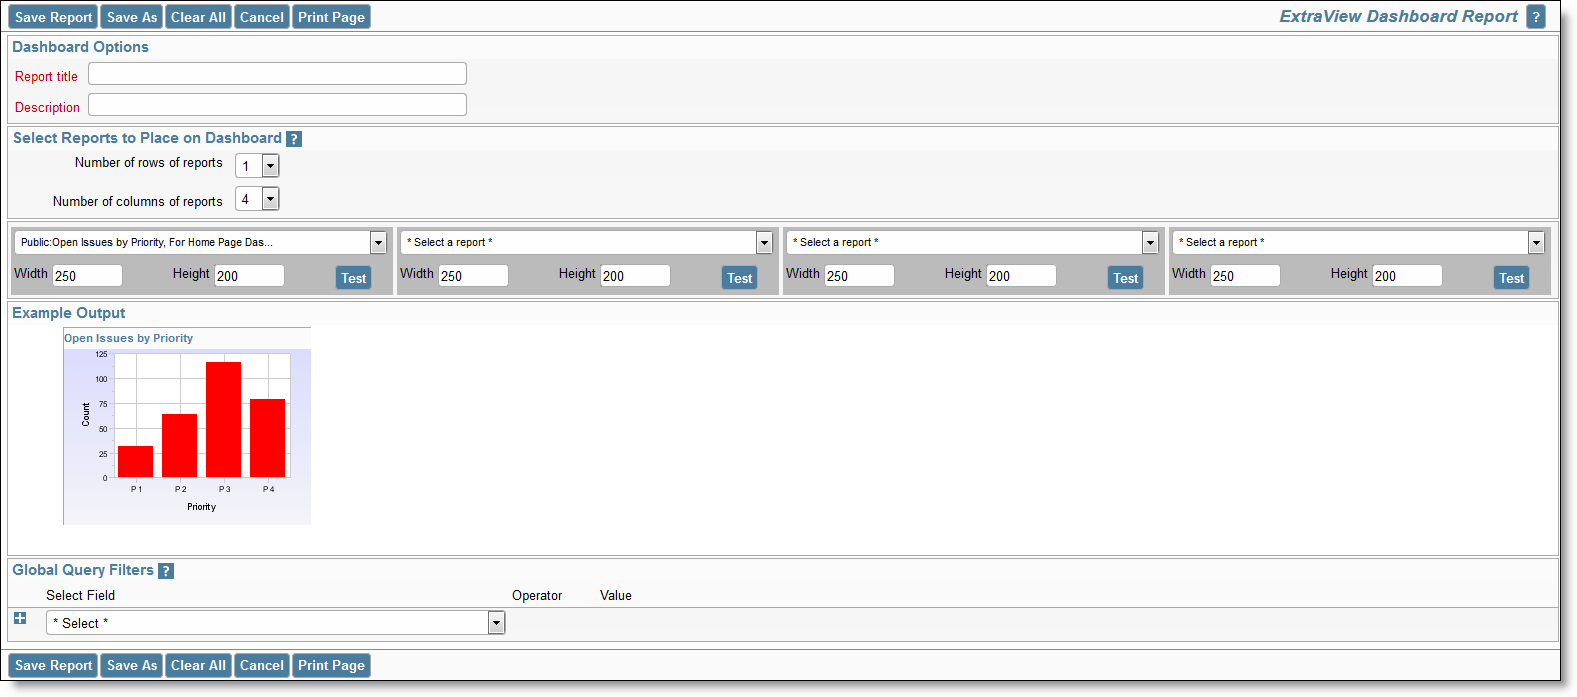
One chart placed on a Dashboard
As you place reports onto the dashboard, it is recommended that you resize immediately. Note that when we placed the next report on the dashboard, we resized the output to a width of 350 and a height of 220, to retain a reasonable presentation of the results. All titles are placed at the top of the individual dashboard reports, and the reports are always rendered with the small font size, no matter the user’s personal option setting. This is to allow sharing of the dashboard amongst users who may have selected different text sizes and to maximize the amount of information on a dashboard.
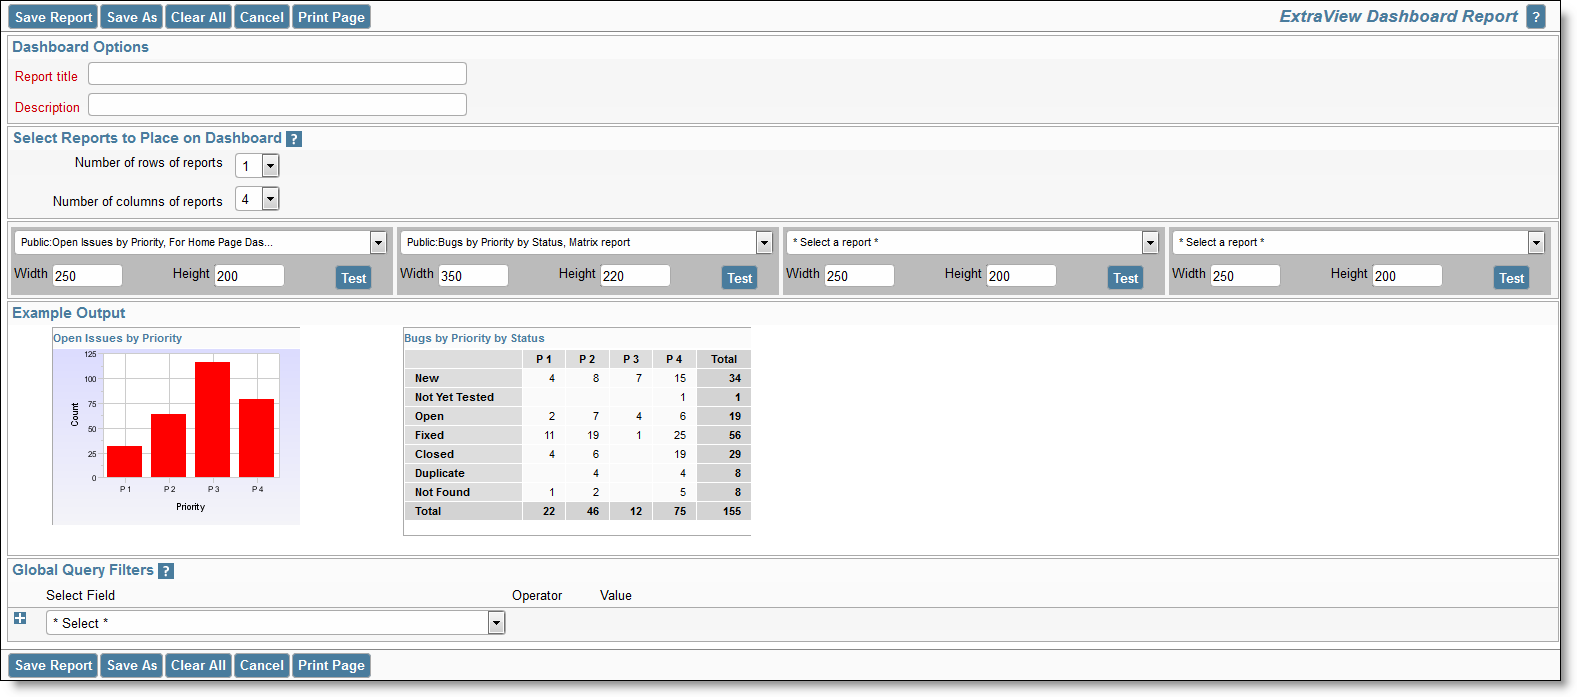
Placing a second report on a Dashboard
Completing a single-row Dashboard Report
Once you have saved your dashboard report, you may place it on your Home Page, in exactly the same way as any other report. Dashboard reports have one special property not shared with other reports. If you are going to share a dashboard across a user role, or make it public, only the dashboard report itself needs permission to be run by the other users. The other users do not need to have permission to run the reports within the dashboard. This permission will be given to them automatically. This allows you to keep the reports within the dashboard as personal reports so that the other users may not individually run or edit these reports. However, the individual field permissions still apply so users will not see fields to which they do not have read permission.
Setting runtime replacement query filters on dashboard reports allow you to apply these filters to all the individual reports configured within the dashboard report. For example, you might want to apply the same date range to all the reports, or to select a single report as a filter for all the reports. Note that if any of the reports contain a filter on a field used as a runtime replacement filter, then the filter at the individual report level is dropped completely and replaced with the runtime replacement filter for the field.
For example, you might want to apply a runtime replacement filter that applies the same date range to all the output, or apply a filter that provides only results from a specific product within the output.
When you specify runtime replacement filters within a Dashboard Report, they will replace filters for the same field within the individual reports that they contain. If a filter on a field specified at the dashboard level does not appear within the contained report, it will have no effect. Further, it is not possible to specify conjunctions for the runtime replacement filters - they simply replace filters for the same field within the contained reports. The runtime replacement filters are always displayed in expanded mode, allowing you to make multiple selections within a field.
Tip: A typical use case might be to create a dashboard that contains several reports about all your products, but you want to filter on the report output by a single product. You cannot select a runtime replacement filter with a value similar to Product = Any, but you can select all the product values in the list and store that as your filter. Then, after viewing the dashboard, you can select a new filter value that is either just one, or a selection of products.