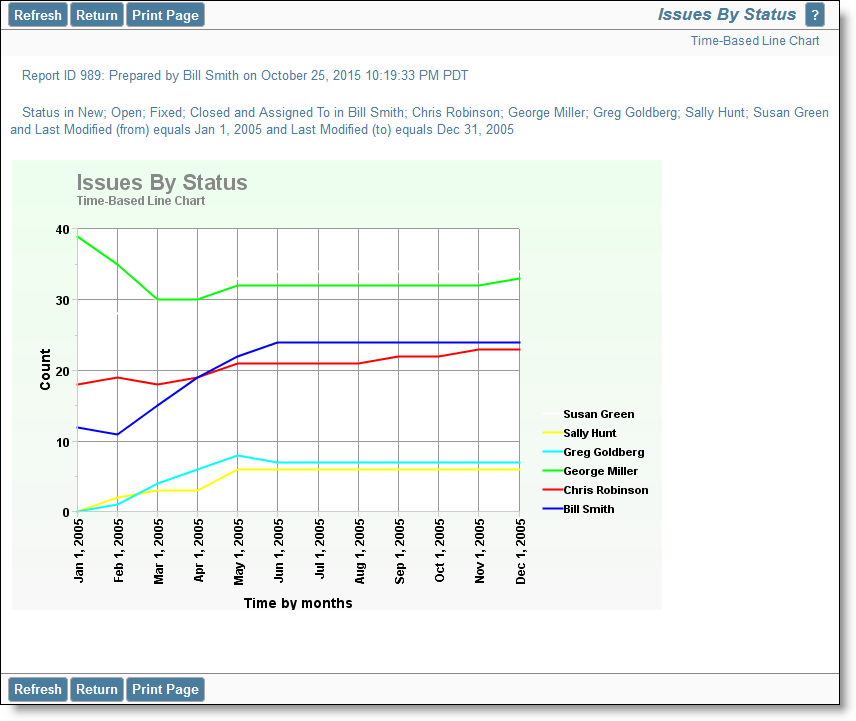
Time-Based Line Charts
Choose the time-based line chart type from the chart selection list. Complete the remainder of the form as follows:
-
Select the field to chart. The list presents all the potential enumerated list fields which are eligible for the chart type
-
From the field you select, you can choose one, multiple or all the values within the field
-
Select the Start and End dates. Note you can choose $$SYSDAY$$ to represent the current day, and you can perform simple arithmetic on the date. For example, $$SYSDAY$$ - 30 represents 30 days ago
-
Choose the increment for the X axis, from days, weeks months and years
-
Cumulative results include every item that matched criteria during the time period you selected. If this box is not checked then only the items that first transitioned to match criteria in the given time period are used to calculate the values displayed on the chart.
A sample time-based line chart looks like this:
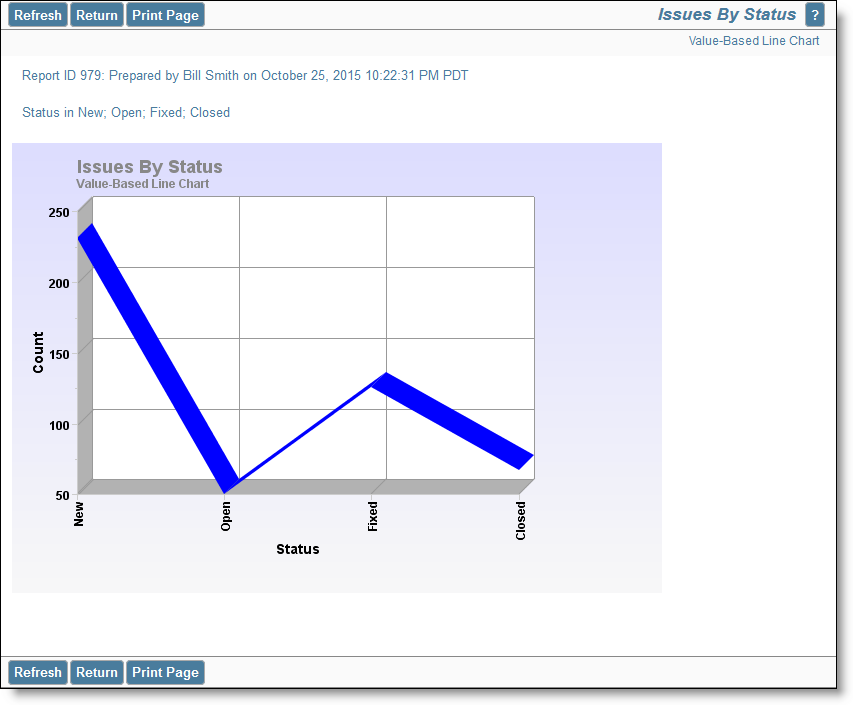
Value-Based Line Charts
Choose the value-based line chart type from the chart selection list. Complete the remainder of the form as follows:
-
Select one or two fields to chart. The lists presents all the potential enumerated list fields which are eligible for the value-based are chart type
-
The current point in time is used to draw the chart
-
If you want to use only some of the values within the field(s) you selected, set a filter for the field, and select the values you want to display on the chart output
A sample value-based line chart looks like this: