Charts as layouts are prepared by first designing the chart in the standard way as explained in this documentation section. The chart is any that you create, with any filters.
To prepare a chart layout, choose the Create layouts for existing reports from the Query / Report Options list and press the GO button. After pressing the radio button Chart at the top of the screen, you will see the following:

Preparing a chart layout
To prepare the report:
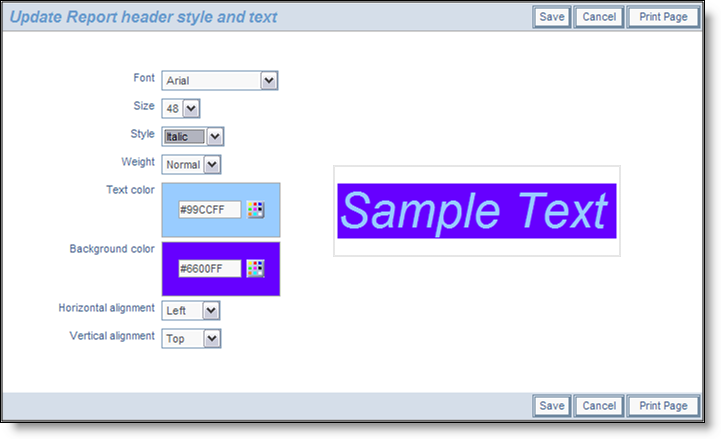
Setting the style of an element on a PDF report
First create and save a chart. For our example, we created a pie chart with the title of My Open Issues. Then we place this chart onto the layout:

Sample Chart Layout
Note that we simply used the style buttons to embellish the column report output to the PDF. As a result, it looks like the following sample report.
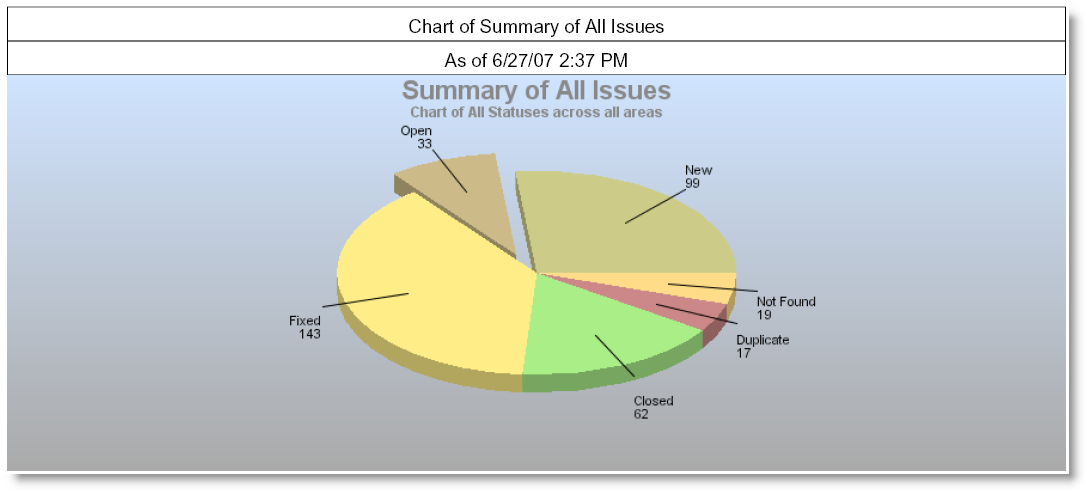
Sample Chart as a PDF