Single group by layouts are prepared by first designing one or more Summary reports, each with a single field as the object of the summary list. For example, you may prepare a Summary report using the product_name or the area field. Any filters may be applied to each of the reports.
Further, each of the summary reports may use a different field as its object. This will allow you to prepare a layout where each row or column of the layout represents a totally different variable being counted. Thus you can have different rows or different columns represent different information on a single report.
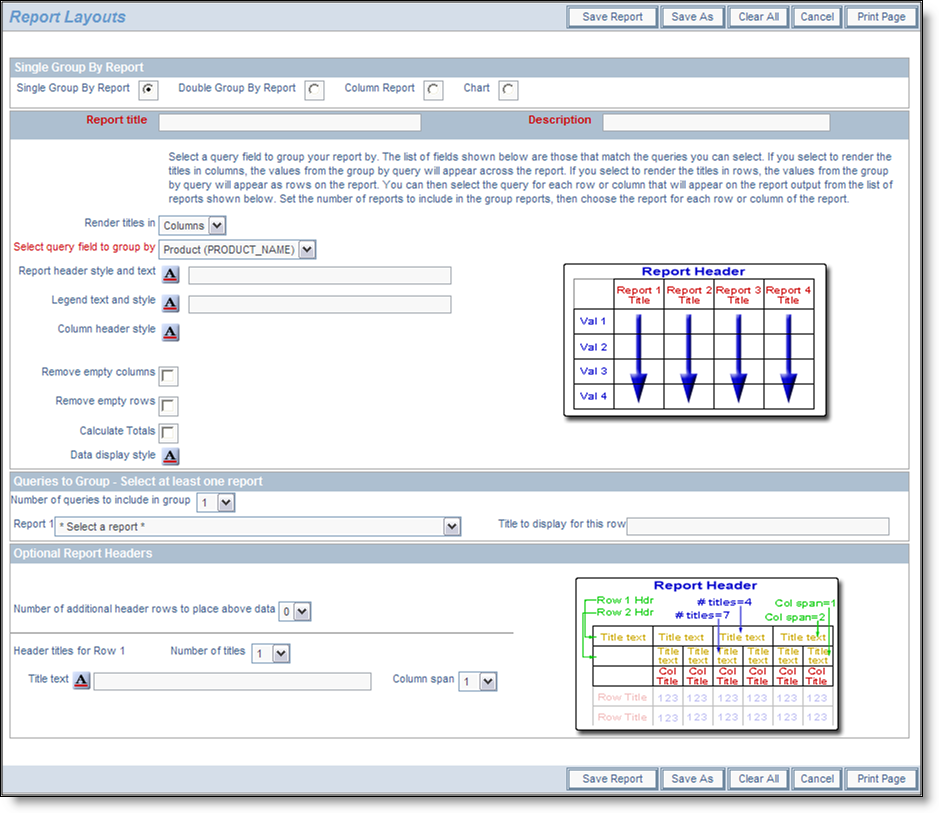
To prepare a Single Group By layout report, choose the Create layouts for existing reports from the Query / Report Options list and press the GO button. You will see the following screen:
Preparing a single group by report
Note that the radio button selection at the top of the screen already reflects your choice of the Single Group By report. To prepare the report:
- Decide whether the titles for each Summary report that is to be rendered are to be in the columns or rows of the report. Notice that the image that portrays the style of the report changes to represent your choice
- Within the field Select query field to group by, you will see a list of all the Summary reports that are possible to select. These will all be Summary reports that have a single field selected for the summary. These reports must all exist before you create the layout
- Enter the text for the report header and for the legend to appear under the header
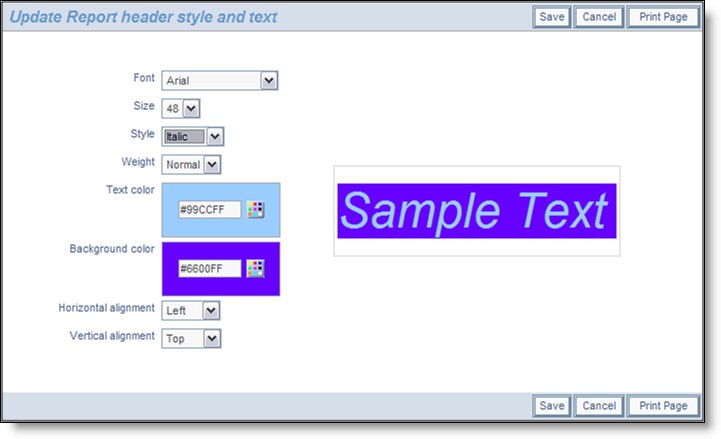
- For each of the report header, the legend, the column header and the data display, you can set the style of the output by using the
 button. When you hold your mouse over the button, you will see a summary of the style that is set. When you click on this button, you will see a pop up window where you can set the style
- There are options in the form of checkboxes that allow you to suppress empty columns and empty rows on the report output
- Next there is an option that you can check to automatically compute totals for the report. If you are rendering titles in Columns, then you will get column totals, if you are rendering the output in Rows, then you will get row totals on the output
- Next, you set the number of queries you want on your report. For each query, you will have a selection list from which to select the reports. Then you select the reports, and you select the title to display for each of the reports
- You are able to create complex, multi-line headers above the columns of data, using the capability in the Optional Report Headers section. You define the number of header rows, and then for each row you can define how many individual headers you require, and how many columns each of these will span. Please be careful to calculate these numbers accurately, as ExtraView does no checking and incorrect calculations will lead to strange-looking results. The diagram on the screen shows how the optional headers will appear
- When you have completed the screen, Save the report. Note that you cannot run the report directly; it must first be placed in a container report before you can run it and output it to a PDF.
Example Single Group By Report
First create and save three summary reports. Each of these has the product_name field (titled Product) as the selected field. For each of the three reports, select a single filter, as follows for each report:
- Status = Open
- Status = Fixed
- Status = Closed
You will now have three summary reports titled something like:
- Summary of Open Customer Issues
- Summary of Fixed Customer Issues
- Summary of Closed Customer Issues
Now we will place these fields onto the layout:

Sample Single Group By Report
Notice how we supplied the field to group by as Product and then set up three queries to include. Of course, these are the three summary reports we set up earlier in the example. For this example, we also set up some additional header rows as shown on the screenshots. If we save this, then include into a container report, and run the container report, we will see results similar to this:

Sample Single Group By Report